Recent changes
- 2026-05-12
- Added §5.4 "What Counts as a Megawatt" — methodology section on the ELCC framework spread across utilities (Avista's 82% vs PSE's 16% on the same 4-hour battery; WRAP, NWPCC, and PacifiCorp framework variance). Includes Figure 5.4.
- Renumbered old §5.4 "The Coordination Gap" to §5.5.
Section 1: Two Futures
Section 1 lays out two futures for the Pacific Northwest grid. The first — the Collision Scenario — is what happens if the region’s institutional architecture continues unchanged. The second — the Coordination Scenario — is what becomes possible if the architecture shifts. Both are constructed from the same physical resources, the same demand growth, the same weather patterns. The fork is institutional, not technological.
1.1 The Collision Scenario: January 2032
Imagine January 10, 2032 in Seattle. A weakened polar vortex has allowed arctic air to spill south across British Columbia. A blocking ridge of high pressure over the Gulf of Alaska holds the cold in place, preventing the usual parade of mild Pacific storms from pushing it out. Dense, frigid air pours through the Fraser River valley into the greater Salish Sea.
Temperatures in Seattle drop to 16 degrees Fahrenheit. Cities across Western Washington have been below 20 degrees for five consecutive days. Families turn up the heat. Electric vehicles draw from the grid on the coldest mornings. Across the region, the system sets an unprecedented peak energy demand.
And then the same high-pressure ridge that trapped the arctic air does something else: it flattens the pressure gradients that drive wind. Turbines across the Columbia Basin slow, then stop. Low, heavy clouds settle over the region, blocking what little winter sun reaches this latitude in January. German grid operators have a word for this condition, the simultaneous collapse of wind and solar generation under a stagnant high-pressure system: Dunkelflaute, the dark doldrums. European grid planners have spent a decade learning to fear it. In the Pacific Northwest, which has built its decarbonization strategy around the same variable resources, the term barely registers. Researchers at Pacific Northwest National Laboratory studied four decades of hourly weather data across the continental United States and found that compound renewable energy droughts, periods when wind and solar fail together, occur in every region.
The PNW’s energy droughts tend to be shorter than California’s (hours rather than days), but they arrive during winter high-demand events when the grid has the least room to absorb them. And in the Pacific Northwest, the dark doldrums come with a third dimension that Germany does not face: when drought years have already drawn down the Columbia River system, hydropower cannot fully backstop the failure of wind and solar. The region faces a three-resource drought and across utility control rooms, the alarms sound as cross-state transmission lines reach the maximum energy they can carry and demand continues to climb.
In January 2024, the Pacific Northwest experienced exactly these conditions. Between January 10 and 17, temperatures in Seattle bottomed at 15 degrees, Portland hit 12, and Spokane plunged to negative 10. Regional power demand peaked at 35,594 MW, the highest load since the aluminum smelters left the system after the Western Energy Crisis of 2000-2001. Wind showed up on January 13 with roughly 1,000 MW of production, then tapered to near zero for the remainder of the week. The region survived by importing over 4,900 MW from California, the Desert Southwest, and the Rockies, while the Bonneville Power Administration (BPA) coordinated emergency operations with the Army Corps of Engineers and the Bureau of Reclamation to squeeze every available megawatt from the federal dams. Even then, BPA was managing the river to minimum flows due to a low water year, and the requirement to save water above Grand Coulee for spring fish operations limited how much additional generation the dams could provide. The backup system was itself running on fumes.
What has changed by 2032 is the system’s capacity to respond. Every utility in the region is drawing its full allocation of power from BPA. The Contract High Water Mark, the ceiling on cheap federal hydropower that each utility locked in back in 2025, is binding. If a utility needs to purchase energy above the ceiling, costs will, at minimum, double. BPA declares a system emergency on day two.
Every utility turns to the market. But the market is split. BPA operates in Markets+. Portland General Electric and PacifiCorp are in EDAM. Scheduling power across the seam between these two competing platforms adds hours to what should be real-time transactions. Prices on both sides spike past $500 per megawatt-hour, then $1,000. In January 2024, a single month of emergency market purchases cost Snohomish PUD ratepayers $45 million. This event will cost multiples of that, spread across every utility in the region.
Then the gas system fails. The same cold that created peak electric demand constrains the fuel supply to the region’s natural gas generators, the plants that were supposed to backstop the grid when hydro and the market fell short. This nearly happened on the day of peak demand during the 2024 event, when a fiber-optic network failure nearly caused an outage at Jackson Prairie, the region’s largest gas storage hub. Now imagine a more permanent failure.
Rolling blackouts begin on day three. Tens of thousands of customers across western Washington lose power in rotating outages as system operators struggle to balance a grid that has run out of options. Emergency operations at BPA face the same choice the agency confronted in 2001: ramp the dams to full generation and sacrifice future salmon survival, or maintain fish protections and extend the blackouts.
In 2001, when the region last faced this choice, the salmon lost. Juvenile steelhead survival rates on the Columbia dropped from 40 to 70 percent in normal years to roughly 6 percent. Treaty-protected fishing rights held by the Yakama, Nez Perce, Umatilla, and Warm Springs tribes were overridden by an emergency that the system’s own planning failures had created. Those rights are the foundation of tribal economies and predate the federal hydroelectric system by centuries. The Columbia River Inter-Tribal Fish Commission (CRITFC) predicted this would happen again. Speaking to the Northwest Power Council in April 2022, Ed Sheets put CRITFC’s concern plainly: “if the lights are about to go out, the salmon protections will go out before the lights.”
The costs to utilities, and by extension anyone paying an energy bill, do not end when the cold breaks. Emergency market purchases, emergency gas procurement, infrastructure damage, and deferred maintenance flow into the next rate case. Utilities that planned independently, each assuming market access that evaporated when everyone needed it at the same time, passed those costs to ratepayers. The desperate attempts individual utilities had made to adapt and expand the system, to meet the compound pressures of growing demand and worsening climate events, are set back further by backlash and burned budgets.
The burden falls hardest on the communities least able to absorb it. Every utility will commission a lessons-learned report. Every report will identify the same gaps. And every recommendation will run into the same three constraints that created the crisis in the first place: contracts that cannot flex, markets that cannot coordinate, and a capacity gap that neither contracts nor markets, as currently designed, can close. These factors come together with a multitude of other political factors to create an energy trap closing in on utilities throughout Washington State. The first half of this paper describes the history and context, the second half is dedicated to how the region can work out from the trap.
1.2 The Coordination Scenario: January 2032
Now return to January 10, 2032. Imagine the same weather, the same cold, and the same five days below twenty degrees fahrenheit. Demand is spiking and generation is falling. BPA has called a system alert. Wholesale prices have spiked. The grid is starting to strain, but in this reality it doesn’t break.
In 2026, a coalition of Pacific Northwest utilities, state energy agencies, and tribal representatives established a coordinated resource adequacy framework that went beyond the Western Resource Adequacy Program’s compliance function. The coalition identified what this paper documents in Section 5: that utility integrated resource plans across the region contained assumptions about market access and resource costs that were mutually incompatible. Multiple utilities were counting on the same market purchases during the same stress events. The coalition created shared planning scenarios and, for the first time, checked whether the region’s individual plans added up. When the plans did not add up, stakeholders across the system pushed forward multiple baskets of solutions.
By 2028, Washington and Oregon had directed utilities to participate in coordinated transmission planning. BPA’s reconductoring program, accelerated by state legislative action, doubled capacity on three critical corridors using advanced composite core conductors on existing towers and rights-of-way. Cost: roughly half that of new line construction. Timeline: 18 to 36 months per corridor, not the 10 to 15 years a new transmission line requires. Dynamic line rating sensors, deployed across more than a thousand miles of regional transmission, monitored real-time conditions and identified 800 MW of available transfer capacity that the old static ratings would have left on the table.
State procurement authority, modeled on Illinois’s Clean and Reliable Grid Affordability Act and adapted for the Pacific Northwest’s institutional landscape, aggregated demand across six utilities. That aggregation gave developers the scale certainty needed to commit capital. The long-duration systems, iron-air batteries capable of discharging for 100 hours or more, were the technology that changed the calculus. For the first time, the region had storage that could ride through a multi-day winter event without solely depending on the Columbia’s seasonal flows.
But the grid of 2032 is not just a bigger version of the grid of 2025. It has changed in kind. By 2032, the Pacific Northwest had built what the old system never had: a distributed energy layer operating alongside the bulk grid, not as a collection of pilot projects but as coordinated infrastructure. Companies specializing in residential battery deployment had installed tens of thousands of home storage systems across the region, manufacturing, installing, owning, and operating them as a fleet. To each homeowner, the battery was affordable backup power and lower bills. To the grid, it was a virtual power plant, hundreds of megawatts of distributed capacity that could be dispatched in minutes. The Pacific Northwest adapted it for its own regulatory landscape: public power districts, investor-owned utilities, and tribal utilities each found structures that worked within their governance frameworks.
Flexibility markets, modeled on platforms already operating at gigawatt scale in the United Kingdom, connected distributed resources to the grid operators who needed them. Water heaters, heat pumps, EV chargers, commercial HVAC systems, and building batteries all enrolled in aggregation programs that shifted load automatically when the grid called for it. The technology was not exotic. Smart thermostats and connected appliances had existed for years. What was new was the market infrastructure: standardized enrollment, transparent pricing, and automated dispatch that turned millions of individual devices into a coordinated resource. Every electrified home, every electric vehicle parked in a garage, every commercial building with a smart energy management system became both consumer and contributor.
Community microgrids, backed by the same long-duration storage reaching commercial scale for the bulk system, provided resilience where it mattered most. Rural communities in fire-prone areas of eastern Washington and southern Oregon could island from the grid during emergencies and sustain essential services for days. Tribal communities whose energy infrastructure had been chronically underfunded gained distributed generation and storage that reduced their dependence on a transmission system built to serve someone else’s priorities. Low-income neighborhoods that had borne the worst outages during past cold events gained backup capacity and bill management tools deployed under CETA’s equity provisions. The communities most exposed to grid fragility were the first to benefit from the new system, not the last.
During the January 2032 cold event, this distributed layer reduced peak demand by 400 MW across the region, not through emergency appeals for conservation but through automated, compensated, planned response. Cross-market scheduling protocols, negotiated through the Regional Organization for Western Energy governance framework, enabled resource sharing across the EDAM/Markets+ seam. BPA’s hydro operations balanced generation with salmon protections under emergency protocols developed with CRITFC in advance, not under duress. The protocols existed because tribal representatives had been in the room when the planning framework was built.
Rates increased throughout Washington State. However, the price increased predictably, with advance notice, and the households with the least capacity to absorb price spikes had distributed resources that helped them manage the impact. The burden was shared. It was not equal, but it was visible, and it was planned for.
No blackouts. No emergency gas procurement. No impossible choices between the lights and the river.
The Coordination Scenario is not the absence of problems. It is the presence of institutions and infrastructure capable of managing problems that no single utility can solve alone: a bulk system strengthened by coordinated transmission and long-duration storage, and a distributed layer that turns every building and vehicle into a participant in the grid’s resilience. The Pacific Northwest built one of the world’s great energy systems on one river’s power. This scenario imagines a system built on the same region’s wind, sun, storage, and the intelligence of a grid that learns from every node.
1.3 The Present Moment
The decisions that determine which of these futures the region inhabits are being made right now. Many of these decisions have already been made or are seeing decisions windows rapidly close.
In December 2025, BPA countersigned Provider of Choice contracts locking in utility power allocations through 2044. In December 2024, BPA chose Markets+ over EDAM, splitting the Western day-ahead market into two competing platforms. E3’s April 2026 final resource adequacy study measures the Greater Northwest shortfall two ways. Against existing and committed resources alone, the region is 8,689 MW short by 2030, roughly the generating capacity of the state of Oregon. Against existing, committed, and currently in-development resources, the gap narrows to 5,600 MW across the Greater Northwest and 2,600 MW within the Pacific Northwest subregion specifically. An independent review commissioned by GridLab, treating coal-to-gas conversions as retained capacity rather than retirements, estimates the 2030 need at 1.0 to 4.9 GW depending on load growth. The range itself is the point. The shortfall is not a single number. It is a function of what the region chooses to build, retain, and coordinate over the next four years.
Every utility in the region is deep in a planning cycle that will lock in resource decisions for a decade or more. The next round of utility rate cases will set prices through 2030+. Transmission investment decisions being made this year will determine what can be built, and where, for the next fifteen plus years. However, many of these planning processes are running on assumptions that the rest of this paper will show are collectively unrealistic.
The window for coordination is not closing. For some decisions, it has already closed. For others, it remains open but narrowing with each rate case filed, each contract signed, each planning cycle completed in isolation. This paper is an attempt to map the full landscape of these interlocking constraints, to surface the contradictions that individual utility planning cannot see, and to identify the specific institutional changes that could shift the region from the collision path to the coordination path.
1.4 The Three Crises and the Energy Trap
Three crises are converging simultaneously in the Pacific Northwest electricity system.
The Shrinking Federal Foundation: The BPA contracts that govern the region’s federal hydropower were just locked in for sixteen years, freezing each utility’s allocation while the underlying river system contends with warming water, declining snowpack, and tribal treaty obligations that require water for salmon passage. The federal foundation is not growing to meet demand. It is contracting.
The Fragmented Market: BPA’s choice of Markets+ over EDAM splits the Western day-ahead market into two competing platforms at the moment regional coordination matters most. The governance concerns that drove the choice are legitimate. The cost is real: less efficient dispatch, harder access to diverse resources during stress events, and no entity coordinating transmission planning across the seam.
The Widening Capacity Gap: Independent studies disagree on the magnitude but agree on the direction. The region needs more dependable winter capacity than current plans will deliver, and the resources utilities are building most aggressively contribute the least during the multi-day cold events that define reliability risk. Utilities are also no longer the only buyers — technology companies are acquiring shovel-ready projects directly, removing them from a pipeline already insufficient to close the gap.
These three constraints are not parallel problems. Each blocks the standard response to the others, and each tightens as the others tighten. Section 3 examines that interlock in detail.
1.5 The Stakes From Where You Sit
Different readers will arrive at this paper from different professional vantage points. The analysis that follows is designed to serve all of them, but the stakes land differently depending on where you sit.
If you build, install, or finance clean energy in the Pacific Northwest, the region desperately needs what you are building, and the institutional architecture has made it hard to build. The capacity shortfall is not an abstraction: somewhere between 1,000 and 8,700 megawatts of dependable winter capacity that does not exist yet. Closing it requires resources at every scale, from bulk transmission down to the battery in a customer’s garage. Distributed and utility-scale buildout are reinforcing, not competing — every megawatt residential storage, demand response, and rooftop solar can shave is one that does not have to fight through a congested interconnection queue at PPA prices already running 15 to 35 percent above what utilities budgeted. The paths forward would create the largest sustained clean energy deployment opportunity in the region’s history, and the distributed side can move faster than anything else in the pipeline.
If you care about climate, environmental justice, and the communities that bear the costs of an energy system they did not design, this paper documents how the energy trap’s consequences fall hardest on the people least able to absorb them. Emergency market purchases during the January 2024 cold event cost Snohomish PUD ratepayers $45 million in a single month, and those costs flow into rates. For households already spending more than 10 percent of income on electricity, every rate increase driven by planning failures is a transfer of institutional risk onto the people with the least capacity to manage it. The analysis of tribal treaty rights and CRITFC’s two-decade institutional leadership is the argument’s moral and analytical center: communities with the longest relationship to this landscape have been saying since 2003 that the system needs fundamental redesign, not optimization within a broken framework.
If you are a utility planner, state energy office staffer, or consultant who already knows most of the facts in this paper, the contribution is synthesis, not discovery. You know the BPA contract structure, the market fragmentation debate, the capacity numbers. What you may not have seen is what happens when all three constraints bind simultaneously, because no institution’s planning mandate spans all three. The region’s individual utility plans do not add up when read together: simultaneous import assumptions, overlapping resource claims, cost projections already overtaken by the market. These contradictions are visible only when someone reads across IRPs on the planning cycle’s own timeline. The gap between the region’s diagnostic capacity and its institutional capacity to act on what it knows is the problem this paper is trying to close.
If you sit on a utility board, serve on a city council with utility oversight, or vote on energy policy in the legislature, the decisions documented here are decisions you authorized, will be asked to authorize, or can influence. Your general manager signed Provider of Choice contracts in December 2025. Your next rate case will set prices through 2030 or beyond. Your board will take positions on WRAP participation, BPA product elections, and new procurement to close the gap between what BPA provides and what your community needs. The contracts run through 2044. The decisions that determine whether those contracts govern a resilient system or a fragile one are concentrated in the next three to five years.
Section 2: How We Got Here
The two futures described in Section 1 fundamentally diverge because of institutions, not technology or geography. Understanding why the PNW’s institutions constrain the responses available today requires tracing how they were built, what crises shaped them, and what assumptions they encoded as they developed.
2.1 The Machine Built for Abundance
The Bonneville Power Administration was created by the Bonneville Project Act of 1937 to market the electricity generated by Grand Coulee and Bonneville Dams. The founding logic was simple: the federal government had invested massively in Columbia River hydroelectric infrastructure, and someone needed to sell the power. BPA’s statutory mandate gave preference to public utilities and cooperatives, creating the region’s distinctive public power system. The Northwest Power Act of 1980 expanded that role, directing BPA to meet the firm power needs of its preference customers and to acquire new resources if needed.
For decades, the system delivered. The Federal Columbia River Power System, 31 hydroelectric projects generating approximately 9,089 average megawatts under normal water conditions, produced more electricity than the region consumed. BPA sold the surplus to aluminum smelters and other energy-intensive industries, and the cheap hydropower attracted still more of them. Savings from the cheap hydro power and hungry industries passed on to rate payers. Much of the region’s entire economic identity formed around the assumption of abundant, inexpensive electricity.
That assumption became institutional muscle memory as decades of slow and steady growth caused concerns, but no crippling crises. BPA’s contracting structure, its rate-setting methodology, and its relationships with more than 140 preference customers all optimized for a world where the federal system had power to spare. Senator Henry Jackson, writing in support of the Northwest Power Act in 1980, warned that the region’s “era of abundance has abruptly ended” and that it faced “substantial electric energy deficits for the foreseeable future.” He was right, briefly. Load growth stalled in the 1990s, energy efficiency programs exceeded their targets, and what had looked like approaching scarcity dissolved back into comfortable surplus. The institutional apparatus built for abundance survived its first test because the test turned out to be temporary.
But between Jackson’s warning and the return of surplus came the region’s most spectacular failure of energy planning, and the institutional scar tissue it left behind would shape decisions for decades.
2.2 The Scar: WPPSS and the Fear of Big Bets
In the 1970s, the Washington Public Power Supply System, a joint operating agency of 23 publicly owned utilities, set out to do what this paper’s Section 7 argues the region needs to do now: build large-scale generation capacity to meet projected demand growth. WPPSS committed to constructing five nuclear power plants simultaneously, using three different designs, managed by a board of farmers and small businessmen with no nuclear experience. The projected cost at the outset was $4.1 billion (~$16 billion today). By 1982, the estimate had reached $23.8 billion. The demand forecasts that justified the plants proved wildly wrong: conservation measures spurred by the oil crises of the 1970s, combined with economic recession across the Northwest, eliminated the projected need entirely. Two plants were canceled, two were mothballed, and only one, Columbia Generating Station, was completed. In July 1983, WPPSS defaulted on $2.25 billion in municipal bonds, the second largest municipal bond default in U.S. history and rewriting municipal bond bankrupting terms for the country. The agency acquired a nickname that stuck: “Whoops”.
The financial damage was enormous, but the institutional damage ran deeper. Oregon’s 2025 Energy Strategy still references WPPSS as a “cautionary tale where over-investment and cost overruns led to the largest municipal bond default in US history.” In several of this paper’s author’s view, the region’s public utilities drew a lesson from WPPSS that was correct in the specific and damaging in the general: big capital bets on generation are dangerous. That lesson reinforced dependence on the existing hydroelectric system and on bilateral contracting rather than new construction, breeding an institutional conservatism around large-scale energy investment that persists today. It is visible in the slow pace of transmission development, the reluctance to commit to large scale capital projects, and the preference for incremental procurement over transformative buildout. The region that needed to learn how to build better instead learned to be afraid of building at all.
WPPSS was renamed Energy Northwest in 1998. Columbia Generating Station continues to operate, licensed through 2043. But the psychological infrastructure of the failure, the deep institutional wariness of ambitious generation projects, never got a name change.
2.3 The Crisis That Taught the Wrong Lesson
In 2000 and 2001, the Pacific Northwest experienced what the Northwest Power and Conservation Council later described as a “perfect storm.” Drought reduced hydro output while the California deregulation disaster pulled power south, and market manipulation by Enron and others drove wholesale prices to unprecedented levels. BPA had overcommitted its system. The result was an emergency: curtailed industrial loads, power purchases at extreme cost, and roughly $4 billion in losses to BPA customers.
The crisis revealed what happens when reliability pressures collide with the Columbia River’s other obligations. The Columbia River Inter-Tribal Fish Commission documented that in 2001, just 6 percent of juvenile steelhead survived their in-river migration from Lower Granite Dam to Bonneville Dam. In normal years, the survival rate runs 40 to 70 percent. When the choice narrowed to keeping the lights on or protecting salmon, the salmon lost. Treaty-protected fishing rights held by the Yakama, Nez Perce, Umatilla, and Warm Springs tribes were overridden by an emergency that the system’s own planning failures had created. Those rights are the foundation of tribal economies and predate the federal hydroelectric system by centuries. CRITFC’s response was direct: the tribes developed their first Energy Vision in 2003 specifically to prevent the region from ever facing that choice again.
The NWPCC identified the root cause in blunt terms: the problem was “inaccurate energy forecasting by the region’s electric utilities and Bonneville.” However, the institutional response optimized for the wrong variable. Rather than building mechanisms for flexible regional coordination, the region’s utilities and BPA spent the next seven years negotiating a framework designed above all for contractual certainty. That framework became the Regional Dialogue, a process where the BPA decided how subsidized energy would be divided between utilities. The choice was understandable: the region had just suffered two traumatic planning failures in two decades, WPPSS from overbuilding and the 2001 crisis from overcommitting. The instinct to lock down certainty, to nail the contracts shut so tightly that neither failure could recur, was rational. These contracts also were the beginning of the energy trap.
2.4 From Regional Dialogue to Provider of Choice
The Regional Dialogue, negotiated between 2002 and 2008, was the most extensive contracting process in BPA’s history. More than 130 public utilities and their representatives spent six years designing the framework that would govern the federal power system’s customer relationships. The central innovation was the Contract High Water Mark: each utility received a fixed allocation of cheap Tier 1 power based on its historical load, with consumption above that mark priced at Tier 2 rates reflecting the marginal cost of acquiring additional resources. The logic was transparent. BPA’s hydroelectric system was a finite resource. Allocating it based on demonstrated need, then pricing growth at its true cost, created both fairness and efficiency incentives. Conservation was rewarded. Growth bore its actual price.
The contracts signed in 2008 covered fiscal years 2011 through 2028, seventeen years. They included a flexibility mechanism that matters more now than it did then: Contract High Water Marks were recalculated each rate period, every two years, allowing allocations to adjust as loads shifted. The mechanism was imperfect, but it meant that utilities whose circumstances changed dramatically were not locked into decade-old calculations.
The Provider of Choice process, launched by BPA in 2020 and concluded with contracts signed in December 2025, carried the Regional Dialogue framework forward for [another sixteen years, through fiscal year 2044][pc-poc-contracts-through-2044-16-years]. It made one change that transforms the system’s character: [Contract High Water Marks are now fixed for the full contract duration. They are calculated once, based on fiscal year 2026 loads, and do not adjust.][pc-chwm-fixed-fy2026-no-adjust] Load growth receives only a 25 percent add-back. Conservation earns a 50 percent credit. The base allocation is frozen. And the policy landscape surrounding these contracts had shifted in ways the Regional Dialogue’s designers never anticipated. [Washington passed the Clean Energy Transformation Act in 2019.][pc-washington-ceta-2019] Oregon followed with HB 2021. The framework built for managing hydropower allocations now had to function within a system being rebuilt around decarbonization mandates that did not exist when the first contracts were signed.
In a period of stable demand, the distinction between adjustable and frozen allocations would be minor. In a period where Snohomish PUD revised its load growth projection upward by 116 percent between its 2021 and 2025 integrated resource plans, where data centers are driving regional demand at four times the historical growth rate, where [BPA itself projects a transition from 960 average megawatts of surplus in 2026 to a 3,091 average megawatt deficit by 2035][pc-bpa-960amw-surplus-to-3091amw-deficit], and where E3’s April 2026 resource adequacy study independently locates a 2,600 MW winter dependable capacity gap in the Pacific Northwest subregion by 2030, freezing allocations for sixteen years creates a structural constraint that no individual utility can escape. A mandate designed for abundance becomes something different in an era of scarcity. BPA is now locked into selling every kilowatt-hour a constrained river system can produce, through contracts designed for conditions that no longer hold, at rates that punish the very growth its own customers are experiencing.
The [contracts were due December 5, 2025. BPA countersigned by month’s end.][pc-poc-contracts-due-dec5-countersigned] They are binding through 2044.
Section 3: The Energy Trap
The contracts described in Section 2 are the floor. What follows is a map of the building constructed on top of it, and an explanation of why the exits are harder to find than they appear.
3.1 First Principles: What a Functional Grid Looks Like
A common refrain is that each grid’s situation is its own unique snowflake based on region, customer base, generation, and many similar factors. A well-functioning electricity grid has three properties: it covers a large geographic area, so that a cold snap in Seattle can be offset by mild weather in Phoenix; it has flexible access to diverse resources, so that low water years or still winds do not leave the system dependent on a single fuel; and it coordinates dispatch across the full system, so that a megawatt generated cheaply in Montana reaches the load center in Portland rather than being curtailed while Portland fires up an expensive gas peaker.
These are the core reasons Regional Transmission Organizations (RTO) exist throughout most of the United States. RTOs exist to coordinate the grid between utilities across vast geographies. They are why the [Western Energy Imbalance Market (WEIM), which only partially optimizes dispatch across a subset of Western balancing authorities, has still generated approximately [$8 billion in cumulative benefits since 2014]]pc-weim-8b-cumulative-benefits expanding energy trading areas, improving the diversity of resources, and coordinating dispatch.
The Pacific Northwest violates all three principles simultaneously. The Western Interconnection contains 38 separate balancing authorities, more than any other region in the country, and those authorities are now splitting into two competing day-ahead markets. BPA’s power allocations are fixed for 16 years regardless of how conditions change and capacity gaps are emerging for almost every utility.
The Pacific Northwest possesses the continent’s most diverse energy portfolio: the largest hydroelectric system in the United States, world-class wind resources in the Columbia Basin and Montana, strong solar potential in eastern Oregon and Washington, geothermal resources, and an operating nuclear plant licensed through 2043. The region does not lack resources. It lacks the institutional architecture to use them. The three crises that follow explain why.
3.2 Crisis 1: The Shrinking Federal Foundation
BPA’s Provider of Choice contracts, signed in December 2025, fix each utility’s access to cheap federal hydropower through fiscal year 2044. The mechanism is the Contract High Water Mark: a ceiling on each utility’s Tier 1 allocation, calculated once based on fiscal year 2026 loads and frozen for the full contract term. Below the ceiling, power costs approximately $35 to $41 per megawatt-hour. Above it, Tier 2 rates roughly double that, reflecting the marginal cost of acquiring additional resources. BPA documented an 83 percent increase in Tier 2 rates between September 2023 and October 2025 alone.
The ceiling is hard. In the one-time 2026 CHWM calculation, load growth that occurred under Regional Dialogue receives only a 25 percent add-back. Self-funded conservation from 2012 through 2023 earns a 50 percent credit. But once Bonneville publishes final CHWMs, neither adjustment recurs. A utility that adds load in 2031 or invests in conservation in 2034 receives no CHWM increase for either. This is the structural break from the Regional Dialogue contracts that preceded it: those recalculated high water marks every rate period, roughly every two years, adjusting for changes in system capability and customer load. The [Provider of Choice framework calculates once and holds for sixteen years. Whatever a utility’s allocation looks like in 2026, that is its allocation in 2044][pc-chwm-fixed-16yr-vs-regional-dialogue].
For utilities whose loads are growing, the math is unforgiving. Snohomish PUD’s CHWM stands at 755 average megawatts. SnoPUD expects to exceed that allocation within the first year of the new contract. The above-CHWM gap grows to 42 average megawatts by 2030, 124 by 2035, and 200 by 2039 (the cap SnoPUD elected for long-term Tier 2 purchases). BPA supplies 76 to 85 percent of SnoPUD’s portfolio. When SnoPUD revised its load growth projection from 0.96 percent to 2.07 percent annually between its 2021 and 2025 integrated resource plans, a 116 percent increase driven primarily by electric vehicle adoption and building electrification, the implications for its BPA relationship changed substantively, not marginally.
Seattle City Light occupies a different position but faces constraints that have worsened dramatically since its last planning cycle. SCL’s estimated CHWM of roughly 600 to 650 average megawatts (based on FY 2010 loads) reflects a utility where BPA supplies approximately 40 percent of the portfolio rather than 80 percent. SCL’s substantial owned hydroelectric generation at Boundary and Skagit dams provides a buffer that SnoPUD does not have. On paper, SCL looked more insulated from the CHWM squeeze.
Then the capacity requests started arriving. In July 2025, SCL’s General Manager Dawn Lindell told the utility’s Review Panel that the situation had changed in kind: “We need to double our nameplate capacity in the next 9 years.” The 2024 IRP showed SCL needed to add 1,825 MW of new nameplate generation to meet transportation electrification, building electrification, and city growth, plus 118 MW of additional conservation. But the IRP was barely published before the numbers moved underneath it. Between April and December 2024, SCL received more than 1,100 MW of new capacity requests, including several data centers, additional university load, and new industrial and commercial customers. Dawn Lindell’s assessment was blunt: while some of it will not materialize, 800 MW of it “actually looks pretty firm,” meaning the utility had severely underestimated its needs. SCL’s plan now calls for wind, solar, geothermal if available, and small modular reactors as baseload, with batteries for single-day peaks. Every megawatt added will cost more than the utility’s current power. [SCL’s 2022 IRP assumed solar PPA costs of $40 to $60 per megawatt-hour, assumptions the market has moved well beyond][pc-scl-2022irp-solar-ppa-40-60]. The 2026 IRP will have to reckon not just with a changed resource landscape but with a demand picture that shifted faster than the planning cycle could track.
And the system generating BPA’s power is not growing to meet the demand pressing against these allocations. Snowpack is declining, shifting when water arrives at the dams and how much energy they can generate. Tribal treaty obligations, honored through law, policy, and court orders, require increased spill for salmon passage, reducing the water available for turbines. Some hydroelectric facilities face relicensing processes that can take a decade, and their owners may choose to decommission rather than relicense as dams reach the end of their projected life and require costly updates and retrofits. The Columbia River Treaty with Canada, renegotiated in 2024, adds another layer of uncertainty about cross-border flows.
BPA itself projects a transition from 960 average megawatts of surplus in 2026 to a 3,091 average megawatt deficit by 2035. E3’s April 2026 study documents a 2,600 MW winter dependable capacity gap in the Pacific Northwest subregion by 2030, arrived at through separate methods and measuring a different quantity than BPA’s energy projection. Two analyses, two frames, one direction. The federal foundation is not just failing to grow. It is shrinking under the feet of the utilities that depend on it.
This is the floor of the trap. Utilities cannot simply buy more from BPA. The ceiling is fixed for Tier 1 subsidized rates. Above it, costs roughly double. And the system beneath that ceiling is losing capacity to the physics of a warming climate and the legal obligations of treaties that predate the dams themselves.
3.3 Crisis 2: The Fragmented Market
In December 2024, BPA chose to join SPP’s Markets+ rather than CAISO’s Extended Day-Ahead Market. To understand why that sentence carries such weight, you need to know what these two markets are. Starting in 2014, CAISO (the California Independent System Operator) offered the WEIM as a voluntary real-time trading platform. It worked well and grew to cover most of the Western Interconnection. The natural next step was extending that coordination to the day-ahead market, where utilities commit generation and lock in schedules for the following day. Two competing platforms emerged. CAISO proposed the Extended Day-Ahead Market (EDAM), building on the WEIM’s existing footprint. The Southwest Power Pool (SPP), which runs the grid across the central United States, proposed Markets+, designed with an independent governance structure outside any state’s grid operator. The economic case favored EDAM: a larger market captures more trading benefits. The governance case favored Markets+: BPA and many Western utilities viewed CAISO as California-controlled and feared subordinating their ratepayers to decisions made in Folsom. BPA’s December 2024 decision to join Markets+ split the West’s largest transmission owner away from the platform most Western load was expected to join.
The cost of that choice is quantified by multiple independent analyses, and the numbers are large. E3’s own economic evaluation found that EDAM would deliver $69 to $221 million more per year in benefits to BPA customers than Markets+. The Brattle Group’s analysis estimated that EDAM with BPA participation would generate $700 million per year in regional benefits, compared to $300 million without, and concluded that Markets+ may produce a net loss compared to the current status quo. Grid Strategies found that introducing a market seam where none currently exists reduces benefits by approximately two-thirds. These dollar figures capture part of what the market split costs, however they do not capture the most damaging consequence for the region’s capacity challenge.
This paper is not relitigating BPA’s market choice. The governance concerns that drove the decision are legitimate. Markets+ supporters have documented operational issues with CAISO, including load biasing that favors California’s balancing authority and Resource Sufficiency Evaluation failures that have left participating utilities exposed. These are substantive criticisms, not merely political ones. And California’s AB 825, signed in September 2025, creates the Regional Organization for Western Energy (ROWE), a path toward the independently governed market that BPA and its supporters have long called for. The governance problem has a proposed solution on the table. The question is what the fragmentation does in the years it takes to get there.
Three consequences matter for the capacity crisis.
First, the region loses unified transmission planning. Two market operators will generate competing investment signals. FERC staff, in their November 2025 whitepaper on Western seams coordination, identified the core structural difference: unlike Eastern RTOs, EDAM and Markets+ participants will not transfer functional control of their transmission systems to the market operator. Balancing authority areas remain distinct. Transmission availability is still primarily modeled using contract-path methods rather than the flow-based modeling used in the East. The result is a system where nobody plans transmission for the whole region, because no entity has the authority or the data to do so.
Second, utilities contracting for generation on one side of the seam face new friction wheeling power to load on the other. A Washington utility that signs a wind PPA with a Montana project may find that delivering that power across the EDAM/Markets+ boundary involves scheduling complications, congestion costs, and reliability protocols that did not exist when the contract was signed. FERC staff warned that seams coordination in the West will involve more parties and more complexity than the Eastern seams agreements that took decades to develop.
Third, and most consequential for the argument of this paper: no central actor exists to translate the region’s approaching capacity shortfall into coordinated, investable development signals. When a developer considers building a 500 MW wind farm in the Columbia Basin, they need to know which market platform the power will serve, whether delivery transmission will exist, and whether the project can attract a long-term contract. With two competing markets, two sets of scheduling rules, and no entity optimizing for the regional picture, the investment signals are blurred. Developers face uncertainty about which platform to build for. Utilities face uncertainty about whether resources contracted on one side of the seam can be delivered to load on the other. The market split does not just cost money. It removes the institutional machinery the region would need to build its way out of the capacity gap.
3.4 Crisis 3: The Capacity Gap
E3’s Phase 1 Resource Adequacy Study, sponsored by 25 utilities, projects an 8,689 MW capacity shortfall across the Greater Northwest by 2030. That headline number is contested, and the contest matters.
GridLab and Sylvan Energy Analytics reviewed E3’s methodology and identified specific assumptions that may overstate the gap. E3 holds firm imports constant at 3,750 MW across the study period, but actual imports into the Greater Northwest exceeded that figure in 102 hours during the January 2024 cold event, reaching above 5,000 MW in the most constrained hours. E3 models Canadian Treaty entitlements as net exports in all hours, without accounting for Canadian storage that could support imports during extreme events. And E3’s ELCC (effective load carrying capability — the measure of how much dependable capacity a resource actually contributes) calculations use marginal values for individual resource types, which may not capture portfolio effects where the combined contribution of diverse resources exceeds the sum of their individual parts. Renewable Northwest has gone further, characterizing E3’s methodology as “fundamentally outdated and flawed” and arguing that technology costs have declined faster than the study model.
These critiques deserve engagement. GridLab’s own modeling, using more favorable assumptions about imports and large load flexibility, produces a range of roughly 0 to 4.9 GW of additional resource needed, depending on load scenario. That range is wide. Even at its lower bound, the region faces meaningful capacity needs during multi-day winter events. At the upper bound, the need approaches E3’s headline figure. The directional finding is not in dispute: the region needs more capacity than current plans will deliver, and the gap is widening.
One assumption in GridLab’s analysis deserves particular scrutiny because it is doing enormous analytical work. GridLab’s more optimistic scenarios depend on the premise that large loads, primarily data centers, can be placed on special tariffs allowing curtailment during winter stress events. Their own modeling shows the scale of what this requires: depending on scenario and clean resource buildout, large load curtailments range from 55 to 222 hours per year under January 2024 weather conditions. At the high end, that is more than nine consecutive days of curtailment. GridLab’s Finding #4 states directly that supporting reliable winter data center operations in the Pacific Northwest “will likely require resources with more energy availability during challenging winter events.”
The question is whether that curtailment assumption reflects anything close to commercial reality. Data centers exist to provide uninterrupted computing capacity. Their customers pay for availability measured in fractions of a percentage point. Amazon’s CEO has publicly identified power supply as the company’s single biggest constraint on growth. Amazon just spent $83 million acquiring its own generation in Oregon specifically to reduce its dependence on utility-delivered power. Google paid $4.75 billion for a developer’s capabilities. These are not companies that will accept being told their facilities must go dark for days or weeks during the winter months that coincidentally produce peak demand for AI training workloads. A resource adequacy framework that depends on data centers voluntarily curtailing 100 or more hours per year is a framework that has assumed away the problem rather than solved it.
What matters more than the precise number is what kind of gap it is. The Pacific Northwest’s reliability risk is defined not by a four-hour evening peak (the kind of event that batteries handle well) but by multi-day winter cold events where temperatures drop below 20 degrees for five or more consecutive days, wind generation collapses under blocking high-pressure systems, and cloud cover eliminates solar output. During these events, the resources utilities are building most aggressively contribute the least. E3 found that four-hour batteries provide only 3 to 6 percent marginal ELCC during critical winter periods. Eight-hour batteries improve to 6 to 9 percent. Onshore wind contributes 10 to 24 percent. Customer solar, 5 to 14 percent. Natural gas provides 92 to 93 percent.
The reason four-hour batteries contribute so little is counterintuitive until you grasp it, and then it becomes the most illuminating finding in the entire resource adequacy debate. The Pacific Northwest already possesses the continent’s largest fleet of energy-limited storage: the Columbia River hydroelectric system. The dams are, in effect, giant batteries, storing water behind concrete and releasing it through turbines when the grid needs power. Adding more short-duration storage on top of a system already rich in energy-limited resources yields diminishing returns. The first battery on a gas-heavy grid provides enormous value. The hundredth battery on a hydro-rich grid provides almost none, because the grid’s problem is not moving energy around within a day. It is sustaining output across a week-long event when every energy-limited resource is running down simultaneously.
PSE’s scenario analysis made this concrete: to match the capacity contribution of a single 1,000 MW gas plant (at 93 percent ELCC), the region would need roughly 9,400 MW of four-hour battery nameplate. [That is approximately the current installed battery capacity of the entire United States.][pc-pse-9400mw-bess-equivalence] And those batteries would need to be charged during the multi-day events when the wind is not blowing and the sun is not shining.
Execution barriers compound the problem. Nationally, only 13 percent of generation projects submitted to interconnection queues between 2000 and 2019 reached commercial operation. Seventy-seven percent were withdrawn. Average timelines stretch beyond five years. BPA’s own queue contains roughly 120 GW of proposed projects (49 GW solar, 21 GW wind, 51 GW storage), but historical completion rates run 10 to 15 percent. Wind power purchase agreements now cost $67 to $77 per megawatt-hour, rising 14 percent year-over-year, well above the $40 to $55 per megawatt-hour that most utility plans assumed. Battery storage costs have risen 56 to 69 percent above 2023 projections. The One Big Beautiful Bill Act imposed a July 4, 2026 safe harbor deadline for projects to qualify for IRA tax credits. Projects that miss the deadline face effective cost increases of $10 to $20 per megawatt-hour.
And utilities are no longer the only buyers competing for these scarce resources. In January 2026, Amazon outbid Puget Sound Energy in a bankruptcy auction for Pine Gate Renewables’ Sunstone project in Morrow County, Oregon: 1.2 gigawatts of solar generation and 1.2 gigawatts of battery storage, fully permitted and shovel-ready. Amazon paid $83 million. PSE’s final bid was $82 million. For a one million dollar difference, a utility that needed the project to meet Washington’s clean energy mandates lost it to a technology company whose CEO had publicly identified power constraints as the single biggest bottleneck to its data center expansion. PSE’s senior vice president of external affairs captured the new reality: “We are used to being kind of the only buyers for these things as utilities, and now there are other buyers who are a little bigger than we are.”
The Sunstone acquisition is not an isolated event. It is the shape of the new market. Amazon had previously sued PacifiCorp in Oregon for failing to deliver adequate electricity to its data centers, with one campus receiving no power at all. Google acquired the energy developer Intersect Power for $4.75 billion. Technology companies are not waiting for utilities to solve the capacity problem. They are buying the solutions directly, at prices utilities cannot match, removing shovel-ready projects from a pipeline that was already insufficient to close the regional gap. Every gigawatt a technology company acquires for its own load is a gigawatt that does not serve the regional grid.
Whether the shortfall is 4,000 or 9,000 MW, the structural problem is the same: the region needs more capacity than current plans will deliver, the resources it is building contribute the least during the events that matter most, the execution pipeline is congested, expensive, and running out of federal support, and the buyers with the deepest pockets are pulling resources out of the shared pool for their own use.
3.5 The Trap Mechanism: How the Crises Interlock
Each of the three crises described above is, individually, a problem with well-understood responses. Utilities facing BPA allocation limits can buy from the market. Utilities facing market limitations can build their own resources. Utilities facing construction barriers can wait for conditions to improve. What makes the current situation a trap, rather than a set of parallel challenges, is that each crisis blocks the standard response to the other two. The exits are not merely difficult. They lead back into the building.
Walk through it in sequence.
Your BPA allocation is fixed. Your Contract High Water Mark was calculated based on FY 2026 loads. If load grows faster than expected — and SnoPUD’s experience suggests it might — you hit the ceiling. Above-CHWM load pays roughly double. You cannot buy more Tier 1 subsidized energy.
So you turn to the market. But the day-ahead market is splitting in two. BPA joined Markets+; CAISO runs EDAM. If you are on one side of the seam and the cheapest available resource is on the other, you face scheduling friction, congestion costs, and reduced transfer capability. During the multi-day winter events when you most need market access, the same cold snap is hitting every utility in the region simultaneously. Everyone is short at the same time. The fragmented market delivers the least precisely when the need is greatest.
So you try to build your own resources. But the interconnection queue completion rate is 13 percent nationally. Wind PPAs cost $67 to $77 per megawatt-hour, not the $40 to $55 in your IRP. Battery costs are 56 to 69 percent above projections. The IRA safe harbor deadline is July 4, 2026. And you are now competing for equipment, labor, and interconnection capacity not just against other utilities but against technology companies whose capital expenditure budgets exceed the combined revenue of every utility in the region.
Each constraint tightens the others. Fixed BPA allocations push more utilities into the market, increasing competition for limited market resources. Market fragmentation prevents efficient resource sharing, widening the effective capacity gap. The wider capacity gap means more utilities are desperate to build, further congesting the interconnection queue and driving up PPA costs. The system is not just failing in three places. It is failing in a way where each failure makes the other two worse.
SnoPUD illustrates the trap in detail because its data is the richest and its exposure is the most clearly documented, but the logic applies across the region. SnoPUD’s optimization model selected maximum BPA Tier 2 purchases (200 average megawatt cap) in every scenario it tested. Not because Tier 2 is cheap (it is roughly double Tier 1). Not because it is optimal, but because every other option is worse. That is the energy trap in action: when the best available strategy is to pay double for the same federal hydropower you were getting at Tier 1 rates, the system has failed at the level of its design.
The trap is tighter for some utilities than others. Utilities heavily dependent on BPA (SnoPUD at 76 to 85 percent) face the most severe CHWM exposure. Utilities with substantial owned generation (SCL with Boundary and Skagit, Chelan and Grant with their own Columbia River projects) have more flexibility on the BPA dimension, though as SCL’s experience shows, that buffer is shrinking fast. No utility in the region is immune to a shortfall that approaches the generating capacity of the state of Oregon, and no utility can unilaterally solve a coordination problem that is regional in scale.
The natural response to the energy trap is to look to regions that are building better tools. The Pacific Northwest has no capacity market, no single grid operator, no centralized procurement mechanism. Surely a region that has all of those things would handle a demand surge and a constrained generation fleet more effectively. Before turning to how Pacific Northwest utilities are planning within these constraints, it is worth testing that assumption against the one region in the country best equipped to disprove it.
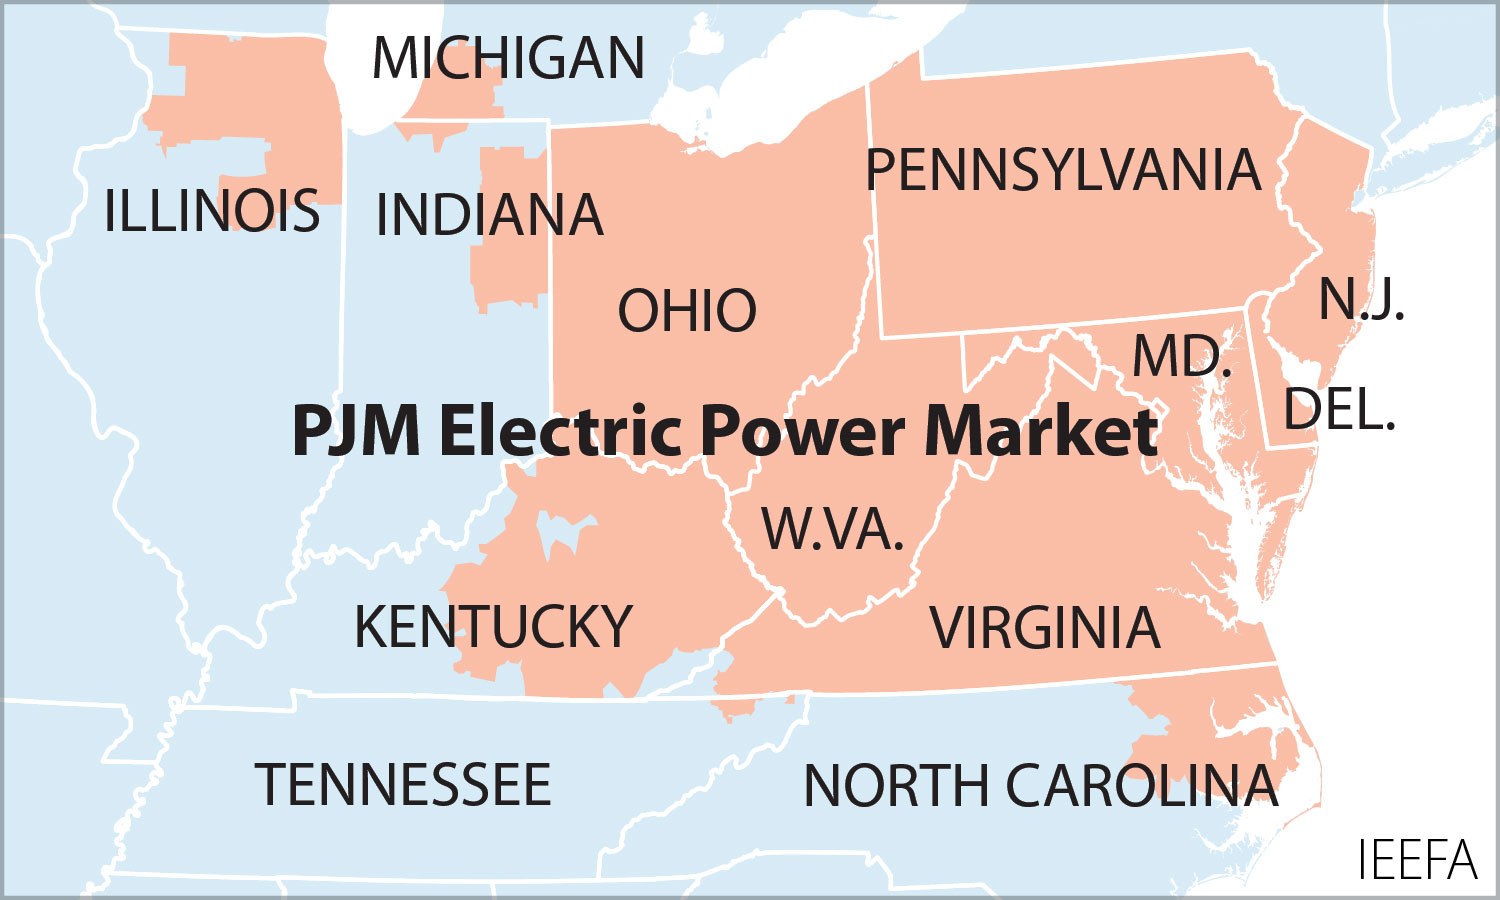
Section 4: The PJM Detour
The PJM Interconnection is the overachiever of American electricity. One regional transmission organization spanning 13 states and Washington, D.C., serving 67 million people. Centralized energy markets, capacity markets, ancillary services markets. Regional transmission planning coordinated across the entire footprint. PJM has been running these systems longer than any other RTO in the country. If any grid operator should be able to handle the collision between rising demand and a constrained generation fleet, it is PJM. As utility planners, policymakers, elected officials, and ratepayers have discovered in sequence over the last three years, PJM cannot.
4.1 The Capacity Market Breaks
PJM’s capacity market was designed to solve the problem the Pacific Northwest now faces. Generators get paid years in advance to commit to being available when the grid needs them. Utilities cannot always own their own generation in wholesale market regions. Capacity markets are additional to energy and ancillary service markets and are used to send supplemental price signals to generators that new supply is needed to meet electricity demand during periods of grid stress. When capacity is tight, prices rise to attract new investment. When supply is abundant, prices fall to signal retirements. The mechanism is elegant in theory and works during periods of stable growth. In practice, it has broken down in a sequence that this paper’s readers should study carefully, because the same forces are at work in the Pacific Northwest without even the market signals to make them visible.
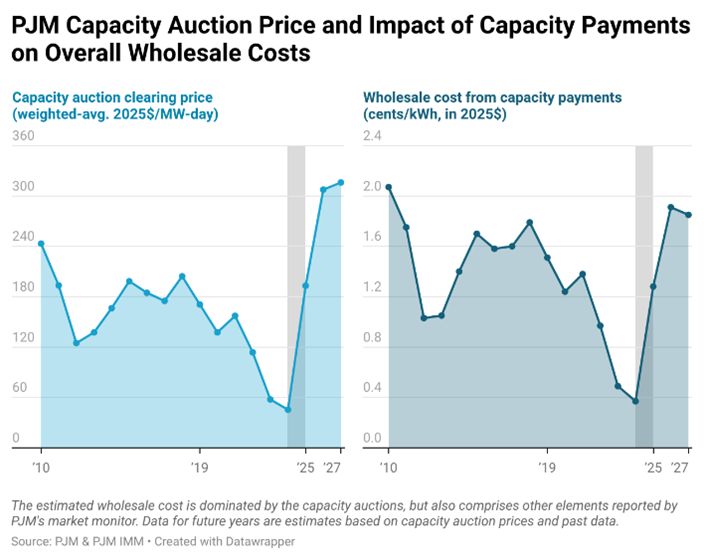
Each year, the capacity auction determines a price to clear that in turn will be paid by the region’s utilities and then ratepayers. For the 2024/2025 delivery year, PJM’s capacity auction cleared at roughly $29 per megawatt-day. For 2025/2026, it spiked to $269.92. For 2026/2027, prices hit a FERC-approved cap of $329.17. For 2027/2028, they hit the cap again at $333.44. Three consecutive record-breaking auctions, each clearing at or near the ceiling. PJM estimates that without Governor Shapiro’s negotiated price collar, the 2027/2028 auction would have cleared near $530 per megawatt-day. The collar saved ratepayers an estimated $10 billion in a single auction year. The market designed to prevent exactly this kind of price escalation instead produced it.
Even at the capped price, PJM could not buy enough capacity. The 2027/2028 auction fell 6,623 MW short of PJM’s reliability requirement: the gap between what the system procured and the 20 percent reserve margin that PJM calculates it needs to prevent more than one unexpected outage every ten years. Reserve margins dropped to 14.8 percent, the lowest PJM has ever recorded. This was the first time the entire RTO, including utilities that self-supply their own capacity outside the auction, fell below the reliability standard. PJM retains enough generation to keep the lights on under normal conditions. The margin for abnormal conditions, the margin that exists precisely because conditions are not always normal, has shrunk to the thinnest buffer in the organization’s history.
The capacity market’s theory holds that high prices attract investment to build new energy generation. A gas plant developer seeing $333 per megawatt-day should be racing to build. But a gas plant responding to the 2024 price signal will not come online until 2031 or 2032, a lag of seven to eight years that covers permitting, siting, interconnection studies, and construction. Battery storage can be built in roughly 18 months. But PJM’s interconnection queue was effectively closed to new entry from 2022 through spring 2026 while the operator cleared a 200 GW backlog. The 2027/2028 auction attracted only 774 MW of new generation. The price signal worked, however the system that goes into building new generation could not respond.
PJM’s governance helps explain the slow institutional response. The stakeholder process has over 1,000 voting members. Fourteen of them are state-appointed consumer advocates. The rest represent the regulated industry. As Clara Summers of the Citizens Utility Board described it in February 2026: it is the regulated industry setting the rules for itself. Twelve reform proposals addressing data center interconnection and capacity procurement went to an advisory vote in November 2025. None of these proposals reached consensus.
4.2 The Data Center Lesson
The force driving PJM’s crisis is the same one reshaping the Pacific Northwest: data centers. In PJM’s latest forecast, data centers account for nearly all of the 5,250 MW increase in peak load, roughly 97 percent. Virginia alone hosts some 643 data center facilities, more than any other state. The Dominion Energy zone expects 20,000 MW of additional data center load by 2037.
The political response has been vigorous and, so far, ineffective at slowing the physical demand. Virginia’s State Corporation Commission approved a new rate class for large customers in November 2025, requiring data centers to pay for at least 85 percent of their contracted distribution and transmission demand. In the 2026 legislative session, Virginia lawmakers introduced bills to shift infrastructure costs to data centers, condition interconnection on grid readiness, and study moratoriums. PJM’s own market monitor told the operator to stop connecting new data center loads until infrastructure catches up. PJM responded that it has no authority to refuse service.
The lesson from PJM is not that data center demand projections are accurate to the megawatt. They are likely overstated. The lesson is that even overstated projections produce real consequences, compounded by existing electrification and the upgrades needed to maintain an aging, climate-exposed grid. The demand that does materialize arrives faster than infrastructure can be built to serve it, concentrates in ways that overwhelm local systems, and comes backed by capital budgets that make regulatory friction a minor inconvenience rather than a binding constraint. Douglas County PUD imposed a moratorium on new data center contracts in 2019 after 40 percent load growth in three years. Grant County PUD’s queue contains 2,897 MW from 75 applicants, with wait times of seven to ten years for new service. The demand did not disappear. It queued into other areas in the grid.
4.3 What the Comparison Proves, and What It Does Not
The Pacific Northwest has none of what PJM has built. Thirty-eight separate balancing authorities instead of one. No capacity market. No centralized transmission planning. A day-ahead market that is splitting in two. This comparison is not an argument that the Pacific Northwest should adopt PJM’s model, and the differences between the regions are real. PJM’s resource mix is fossil-heavy where the Pacific Northwest is hydro-dominated. PJM peaks in summer; the Pacific Northwest peaks in winter. The region’s hydroelectric system provides built-in storage and flexibility that PJM’s fleet does not have. And the Pacific Northwest explicitly chose not to build a capacity market.
What the comparison does is close off two comforting assumptions. The first is that better market mechanisms would solve the problem. PJM has the most mature capacity market in the country. It still faces a 6,600 MW reliability shortfall, three consecutive capacity price caps, and a timeline mismatch between demand growth and supply response. The second is that regulation can contain the demand. At least 12 states are trying. The demand keeps coming, backed by [companies whose quarterly capital expenditures exceed the annual revenue of most utilities][pc-12-states-demand-regulation]. The tools everyone assumed would handle this transition, centralized markets, interconnection processes, legislative oversight, are proving less reliable than anyone thought, in the regions with the best versions of those tools. Attempts to intervene in PJM processes and the interconnection queue have drawn mixed results and a flurry of high-stakes, costly lawsuits.
Other states have begun drawing different conclusions. Illinois, facing the same PJM capacity price spikes and split between two RTOs (PJM and MISO), decided that federal market mechanisms were too slow. In January 2026, Governor Pritzker signed the Clean and Reliable Grid Affordability Act, empowering the Illinois Commerce Commission to directly procure clean energy and storage capacity at the state level. Section 7 will return to what the Pacific Northwest can learn from that choice.
The decisions that determine whether the energy trap tightens or loosens are being made right now, largely inside utility integrated resource plans. The next section examines what happens when individual utilities try to plan their way through a regional problem that their planning tools were not designed to see.
Section 5: How Utilities Are Planning
5.1 The Core Contradiction
An Integrated Resource Plan is a utility’s answer to a deceptively simple question: how will you keep the lights on for the next twenty years, and what will it cost? Every major utility in the Pacific Northwest filed or updated an IRP between 2022 and 2025. Snohomish PUD adopted its plan in December 2025. Seattle City Light is developing its 2026 IRP. Puget Sound Energy is building the state’s first Integrated System Plan, merging resource planning with clean energy compliance into a single document due January 2027. Avista filed its 2025 IRP. Portland General Electric and PacifiCorp filed plans in 2023. Each of these documents represents months or years of analytical work by teams of engineers and economists modeling thousands of scenarios.
Each plan may be internally rigorous. The problem only appears when you lay them side by side. Neighboring utilities serving the same region, subject to the same weather, drawing from the same BPA system and regional wholesale market, are making materially different assumptions about the same future. They cannot all be right. If every utility in the region assumes it can buy power from the market during a winter cold snap, and every utility is short at the same time, the market they are counting on does not exist. If one utility models wind costs at $54 per megawatt-hour and its neighbor across the county line uses market data showing $67 to $77, one of those plans is building a portfolio it cannot afford.
This is not a competence failure. It is a coordination failure. The IRP process is designed to optimize for a single utility’s customers. No mechanism exists to check whether the region’s individual plans, taken together, describe a future that is physically possible. PNUCC, the organization that produces the only regional utility-perspective forecast, states explicitly that its work is “NOT a resource adequacy assessment.” The Northwest Power and Conservation Council’s Ninth Power Plan attempts a regional synthesis, but it updates only every five years. Utility planning cycles run two to four years. The gap between them is where the contradictions hide.
5.2 The Assumption Contradictions
Six categories of planning assumptions diverge across the region’s utilities. Each divergence, examined alone, reflects a defensible judgment call under genuine uncertainty. Examined together, they reveal a set of plans that cannot all succeed simultaneously.
How fast is load growing?
Snohomish PUD revised its base case load growth from 0.96 percent to 2.07 percent annually between its 2021 and 2025 IRPs, a 116 percent increase driven primarily by electric vehicle adoption and building electrification. Avista moved in the same direction but more modestly, increasing its energy forecast growth from 0.24 percent to 0.85 percent annually, citing higher EV projections. Seattle City Light’s 2026 IRP load forecast is, in its own description, “similar to the last load forecast,” with slight shifts between residential and commercial mix and new “spot loads” incorporated in later years. SCL remains somewhat insulated from data center demand by its 131-square-mile urban service territory. PSE, serving the region’s largest investor-owned utility territory, is modeling three deficit categories simultaneously in its ISP framework: effective peak capacity, renewable and non-emitting resource requirements, and total energy.
At what scale, regionally?
At the regional level, the numbers are harder to reconcile. PNUCC’s 2025 forecast projects loads growing by approximately 7,800 average megawatts over the next decade, reaching 31,600 aMW by 2034, an increase of more than 30 percent. The NWPCC’s initial Ninth Power Plan scenarios range from 26,000 to 31,000 aMW by 2030, a 5,000 aMW spread driven largely by data center uncertainty. The PNUCC ten-year energy growth rate has climbed from 0.9 percent in its 2022 forecast to 3.2 percent in 2025. That is not a modest revision. That is a different planning universe.
If SnoPUD’s 2.07 percent growth trajectory materializes across the region, the capacity gap documented in Section 3 is far larger than current estimates suggest. If SCL’s flatter trajectory holds, the gap is more manageable. Both utilities draw from the same BPA system and the same regional market. They are planning for different futures and it is important to understand differences in the cost of projects in these futures.
At what cost?
SnoPUD’s 2025 IRP assumes wind PPA costs of $54 to $58 per megawatt-hour. Current market prices for wind PPAs run $67 to $77 per megawatt-hour, a gap of $13 to $19. SCL’s 2022 IRP assumed solar PPA costs of $40 to $60 per megawatt-hour, assumptions the market has moved well beyond. Battery storage costs industry-wide have risen 56 to 69 percent above 2023 projections.
Every utility’s optimization model selects resources based on cost inputs. If those inputs are 15 to 35 percent below actual market prices, the model produces a portfolio that looks balanced on paper but describes resources that may not be available at the projected price. The plans are optimizing for a market that no longer exists.
Will the market be there?
The assumption that the market will be there when you need it is the most dangerous assumption in Pacific Northwest resource planning. E3’s Phase 1 study holds firm imports into the Greater Northwest constant at 3,750 MW across the study period. GridLab critiques that figure as potentially understating market access, noting actual imports exceeded that threshold during the January 2024 cold event. But the deeper problem is structural. Multiple utilities assume the ability to purchase short-term energy from the market to cover gaps during stress events. If every utility in the region is short during the same multi-day winter event, the collective assumption of market availability is a plan built on power that does not exist. WECC’s 2024 assessment found demand growth across the Western Interconnection is “more than double” what utilities projected in 2022 resource plans, growing at four times the historical rate. Pacific Northwest utilities face competition for the same limited pool of market energy from utilities across the entire Western grid, at the same time technology companies are acquiring resources directly.
With how much margin?
Each of the utilities has a different reserve margin. Avista plans for a 24 percent winter reserve margin. PSE uses roughly 15 to 17 percent. PacifiCorp runs at 13 to 15 percent. The NWPCC has historically used a 5 percent loss-of-load probability standard considered less stringent than other regions. These are not different ways of expressing the same level of caution. A 24 percent winter PRM produces very different resource acquisition signals than a 13 percent PRM. If the region faces a common shortfall, the utility with the lowest reserve margin becomes the weakest link. Reliability failures do not respect utility service territory boundaries.
Which BPA product?
In late 2025, every BPA preference customer faced the same deadline: choose your power product for the next sixteen years. SnoPUD elected Load Following under the Provider of Choice contract after a comprehensive analysis comparing product options across multiple timeframes. The financial difference between product elections runs to hundreds of millions of dollars over the contract term, depending on assumptions about hydro conditions, market prices, and WRAP compliance costs. SCL’s BPA product choice is part of its 2026 IRP process. Each utility conducted this analysis independently, with different models, different assumptions about future conditions, under time pressure imposed by BPA’s contracting deadline, and without any mechanism for regional coordination. These may be the most consequential resource decisions Pacific Northwest utilities have made in a generation. Each utility made them alone.
5.3 What Models Cannot See
Even when individual IRPs are analytically sophisticated, three structural blind spots prevent them from seeing the energy trap.
The first is simultaneity. An IRP optimization model evaluates a single utility’s portfolio against a set of market and weather scenarios. It does not model what happens when every neighboring utility executes the same strategy at the same time. If SnoPUD, SCL, PSE, Tacoma Power, and Clark PUD all plan to acquire wind PPAs from Columbia Basin projects, they are competing for the same limited interconnection points, the same transmission capacity, and potentially the same developers. The models cannot see this competition because they model only one utility at a time. The result is a set of plans that each look feasible in isolation and become collectively impossible when they all hit the market simultaneously.
The second is interconnection reality. Most IRP models assume resources can be acquired at modeled costs and deployed on modeled timelines. The 13 percent historical completion rate for interconnection queue projects, and the five-plus-year average timeline from request to operation, are external constraints that models incorporate imperfectly if at all. SnoPUD’s IRP contains no explicit discussion of interconnection queue backlogs. SCL’s 2022 IRP assumed resource costs now significantly outdated. BPA reformed its queue process in June 2024, moving to a “first-ready, first-served” model, but 376 projects remain in the pipeline with [timelines stretching 900 to 2,330 days][pc-bpa-376-projects-in-pipeline]. A plan that assumes a wind farm will be online by 2029 may be describing a project that will not clear the queue until 2031.
The third is capital competition from outside the utility sector. IRP models assume utilities are the primary buyers of generation resources. They are not. The Sunstone outbid documented in §3.4 — Amazon taking a 1.2-gigawatt shovel-ready project from PSE for a one-million-dollar premium — is the canonical case, and it is not isolated. No IRP optimization model incorporates the possibility that the resources in its optimal portfolio will be acquired by a buyer with a capital budget larger than the utility’s total revenue.
The problem is not that IRP teams lack sophistication. PSE’s transition to an Integrated System Plan, Avista’s 24 percent winter planning reserve margin, SnoPUD’s multi-scenario optimization all reflect serious analytical work. The problem is that the IRP process is structurally designed to answer a single-utility question in a region facing a multi-utility crisis. It is the wrong tool for this challenge, deployed because no better regional mechanism exists.
5.4 What Counts as a Megawatt
Avista’s 2025 IRP credits a 4-hour lithium-ion battery with an 82 percent winter capacity contribution. PSE’s 2026 utility-scale RFP credits the same battery class with 16 percent. Both numbers come from public regulatory filings made within months of each other, both describe a battery that would serve Washington customers, and both purport to answer the same question: how much of the battery’s nameplate capacity counts toward keeping the lights on at peak demand.
Both utilities are measuring the same thing in different ways, and the difference shows up as a five-fold spread in the planning credit assigned to the same hardware. Avista’s 2026 vintage four-hour battery is treated as nearly a firm resource. PSE’s is treated as a meaningful contributor that does only modest work in the specific hours that drive the planning constraint. The difference is the methodology, not the technology.
Effective Load Carrying Capability, or ELCC, is the standard tool. It expresses the share of nameplate capacity that a resource is credited with toward meeting peak demand at a target reliability standard, usually one day of expected loss-of-load per ten years. Avista calls its version Qualifying Capacity Credit, or QCC, and treats it as ELCC-equivalent. The Western Resource Adequacy Program calls its version Qualified Capacity Contribution. PacifiCorp reports forward capacity in megawatts rather than as an ELCC percent and keeps the underlying methodology in confidential workpapers. The Northwest Power and Conservation Council uses an Associated System Capacity Contribution that requires only one model iteration instead of the dozens an ELCC study runs, and the Council’s 2024 and 2025 adequacy assessments have moved to a multi-metric framework that does not produce a single per-resource number at all. The labels vary. The underlying engineering question is the same: how much of this resource’s nameplate capacity is the system likely to actually have available when the system needs it most. What varies is everything that goes into computing the answer.
A utility using a 1-day-in-10-year LOLE standard will produce different ELCCs than one using a 5 percent loss-of-load probability. A utility computing values against its own service-territory peak will produce different ELCCs than WRAP computing against the entire Western Interconnection. A consultant reporting marginal ELCC, the value of the next megawatt added, will produce different numbers than a utility reporting average ELCC across an existing fleet. A study assuming today’s storage penetration will produce different numbers than the same study assuming a 2045 portfolio with thirty gigawatts of batteries already on the system. Avista’s own table shows what penetration does to the answer: a four-hour battery starts at 82 percent winter ELCC in 2026 and drifts to 37 percent by 2045 on the same model, with the only material difference being how many other batteries the utility assumes are on the system by then.
Asking what the correct ELCC is turns out to be a question about which framework you trust, which target reliability you accept, which footprint you draw the boundary around, and which year you imagine. There is no underlying physical number that all the methodologies are converging on. The value E3 reports for a four-hour battery in the 2025 system, as the next marginal megawatt added, is 6 percent. The value Avista reports for the same battery class in 2026, averaged across its planning portfolio, is 82 percent. Both are correct inside the framework that produced them. Neither would be the right number to use inside the other framework.
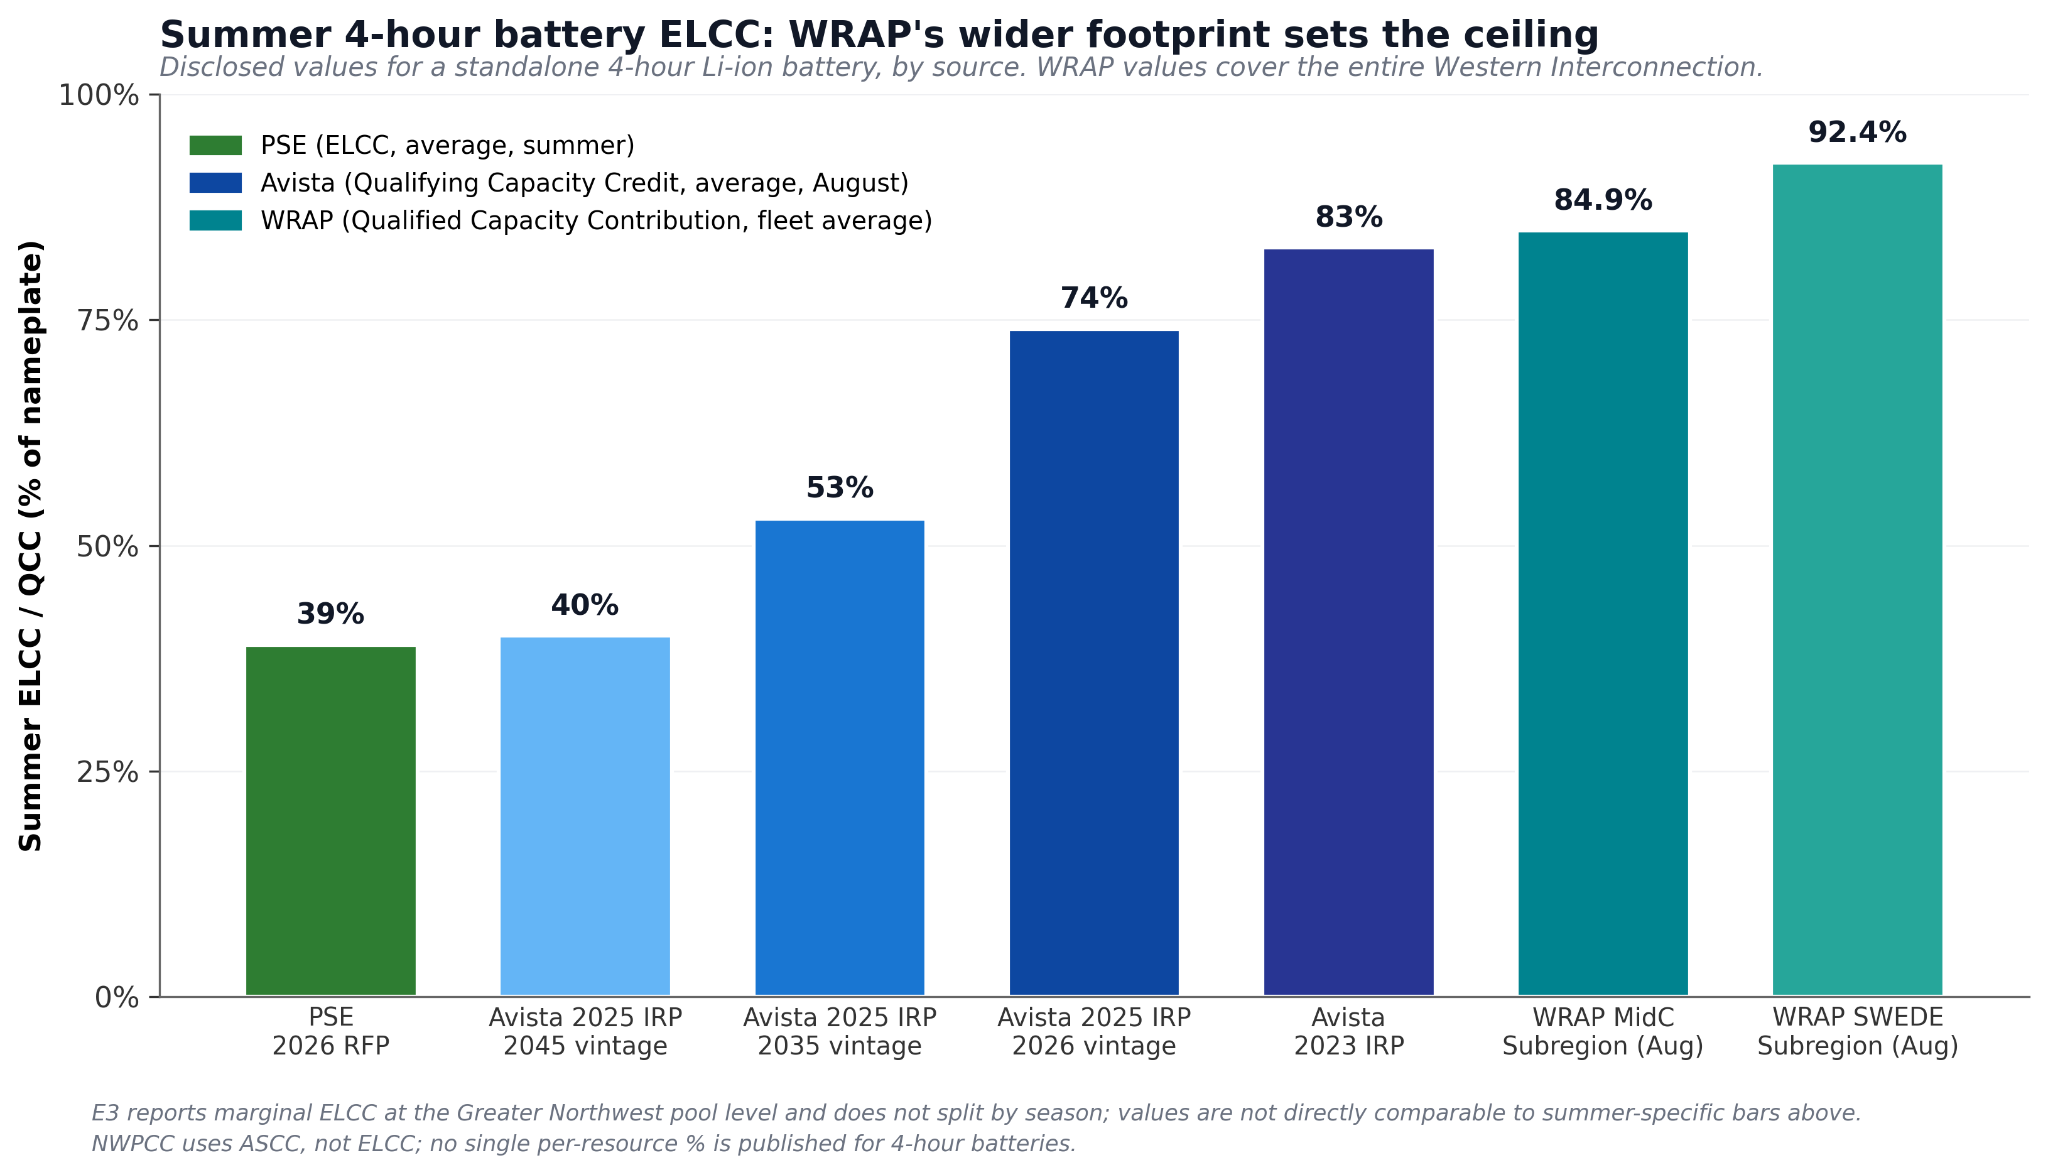
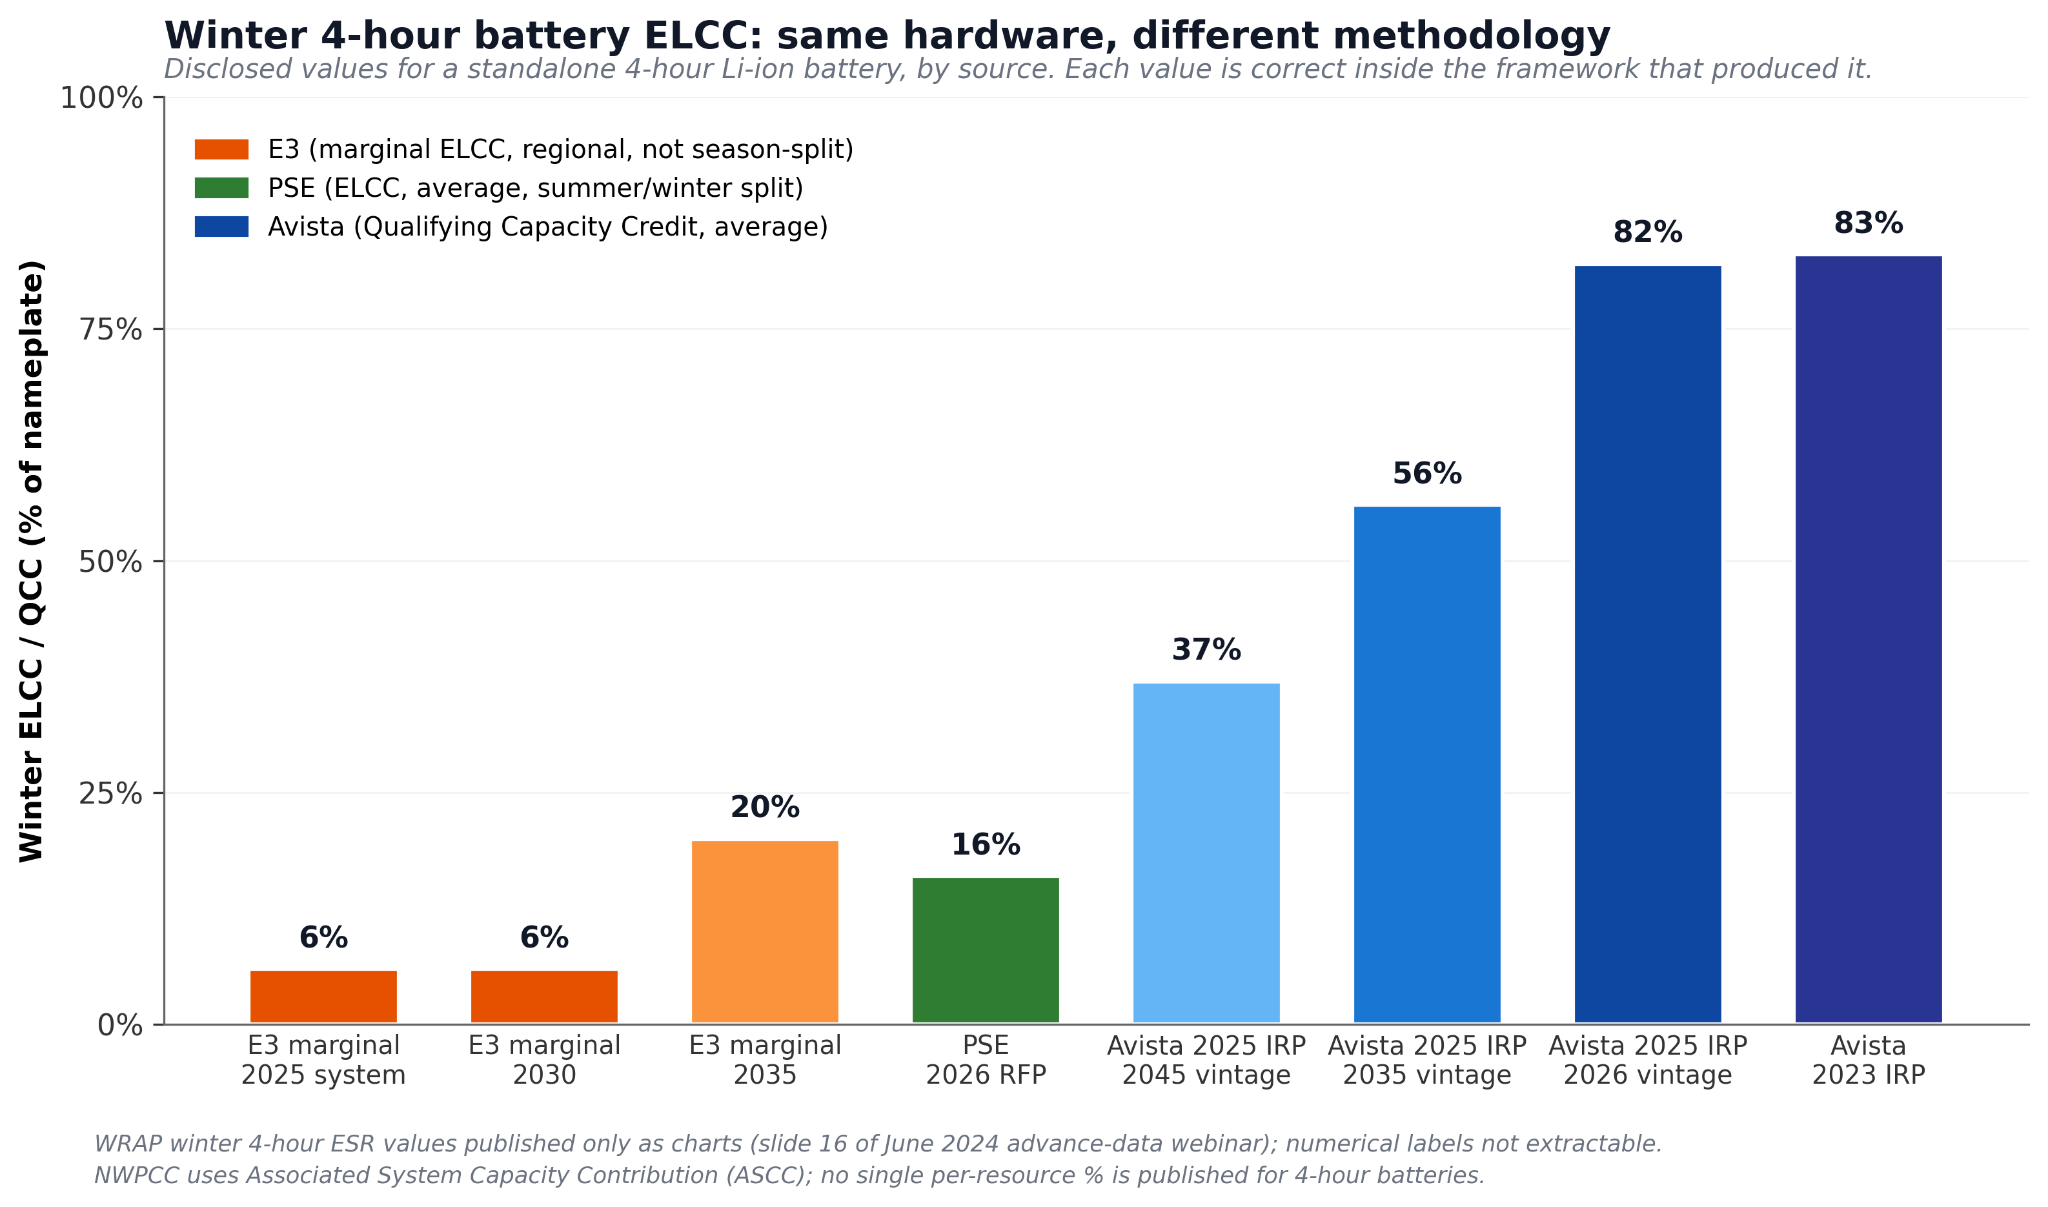
Figure 5.4. Disclosed winter ELCC values for a standalone 4-hour lithium-ion battery, drawn from publicly filed Pacific Northwest sources. Each bar represents the same hardware.
This matters because every IRP optimization model in the region accepts an ELCC value as input and produces a resource portfolio as output. Feed the model a high ELCC and it builds less storage to meet a given capacity need. Feed it a low ELCC and it builds more. The choice of framework, made before the model is even run, has already shaped the answer the model will produce.
The cross-utility consequence is sharper than it first appears. PSE is planning its 2027 Integrated System Plan around four-hour battery winter ELCCs of 16 percent. Avista is planning its 2025 IRP around values that span 37 to 82 percent depending on vintage. The two utilities serve adjacent service territories in the same state, draw from the same regional market, and face the same multi-day winter cold-snap reliability events. They are not building toward the same physical future. They are building toward two different mathematical interpretations of the same physical future, and the regulatory record will eventually have to choose between them or accept that neither is binding regionwide.
WRAP will eventually impose its own set of capacity contribution values on participating utilities through its forward-showing process. WRAP’s summer four-hour energy storage ELCC for the MidC Subregion runs 80 to 91 percent. Its winter values are not yet published as numerical labels, only as visual ranges in stakeholder webinars. When binding operations begin in winter 2027 to 2028, every WRAP participant will face a third set of capacity credits that may not match either their internal IRP framework or their RFP scoring. The compliance values do not have to match the planning values. In the current regulatory architecture, they do not.
A utility using a high ELCC value for storage projects fewer total megawatts of build to meet a given gap. A utility using a lower ELCC value projects more megawatts, more transmission, more cost. Ratepayers absorb that as the difference between resource portfolios. Developers see it as the difference in how much value a battery carries when bid into one utility’s RFP versus another’s. The regional reliability picture inherits a structural ambiguity about how many effective megawatts the Pacific Northwest actually has in any given study year. The question of what counts as a megawatt is not an academic one. It drives every other resource decision the region’s utilities are making, and it does not have a single answer.
5.5 The Coordination Gap
Two emerging mechanisms attempt to bridge the gap between individual utility planning and regional coordination. Neither is sufficient, though both represent progress over what came before.
The Western Resource Adequacy Program is the first regional reliability planning and compliance program in Western Interconnection history. Administered by the Western Power Pool with SPP as program operator, WRAP requires participants to demonstrate adequate capacity seven months ahead of each season. Binding operations are scheduled for Winter 2027/2028, with sixteen participants committed as of October 2025. The program creates regional diversity benefits and enables resource sharing during tight conditions. But WRAP is a compliance mechanism, not a procurement or planning coordination mechanism. It tells utilities whether they have enough capacity to meet standards. It does not help them acquire that capacity, coordinate their acquisition strategies, or reconcile incompatible assumptions across neighboring utilities. If the region is collectively short, WRAP identifies the shortfall. It does not solve it.
The Northwest Power and Conservation Council’s Ninth Power Plan, in development with initial scenarios released in April 2025, represents the most sophisticated regional assessment available. Its five trajectory scenarios and hybrid econometric modeling provide a planning foundation no individual utility can replicate. But the Council’s plan updates only every five years. Utility planning cycles run two to four years. The plan is advisory, carrying institutional weight but no enforcement mechanism. And it cannot compel utilities to reconcile the contradictions their individual plans contain.
What is missing is specific and identifiable. No mechanism coordinated BPA product elections across utilities. No mechanism ensures that utility IRP assumptions about market availability are collectively realistic. No mechanism allocates the cost of data center-driven infrastructure investment to the entities causing the load growth, with the exception of Oregon’s nascent large-load accountability framework, effective February 2025, and Tacoma Power’s proactive large-load rate. And no mechanism exists to conduct the analysis this paper is performing: reading across IRPs to identify where the region’s plans are collectively inconsistent.
The utilities are not wrong to plan the way they do. They are using the tools available to them, within the constraints they face. The deeper question is why those constraints are so binding, and whether the obvious fixes for the capacity gap will actually work within the energy trap described in Section 3.
Section 6: Why the Obvious Fixes Won’t Work
6.1 An Introduction to Challenges
The reader who has followed this paper to this point is likely composing solutions. The three crises are real. The utility plans are contradictory. PJM’s experience shows that even mature market mechanisms cannot keep pace with the collision. So fix it. Build batteries. Build gas plants. Build transmission. Let the markets work. Deploy renewables. Each of these responses is reasonable, and each is part of any realistic path forward. The problem is not that they are wrong. The problem is that each one, pursued within the region’s current institutional architecture, runs into barriers created by one or more of the other crises. The system does not resist any single fix. It resists the combination of fixes, deployed at the speed the timeline demands.
6.2 “Just Build More Batteries”
Battery storage is the fastest-deploying resource in the country. A utility-scale lithium-ion project can move from contract to operation in 12 to 18 months. Costs have fallen by more than 80 percent over the past decade. Every utility IRP in the Pacific Northwest includes significant battery additions. It is the single most popular answer to the capacity question, and for good reason. For evening peaks, renewable integration, and frequency response, batteries are indispensable.
The Pacific Northwest’s reliability problem, however, is not an evening peak. It is a multi-day winter cold event where temperatures stay below 20 degrees for five or more consecutive days, wind generation collapses under blocking high-pressure systems, and cloud cover eliminates solar output. These events last 50 to 100 hours or more. A four-hour battery can cycle once, perhaps twice, during a single evening. It cannot sustain output across a week.
E3’s resource adequacy study quantified what §3.4 documented: four-hour batteries provide only 3 to 6 percent marginal ELCC during the winter events that define the region’s reliability risk. Eight-hour batteries improve to 6 to 9 percent. The hydro-as-storage argument from §3.4 explains why — adding short-duration storage on top of a system already saturated with energy-limited resources yields diminishing returns — and the E3 numbers nail the magnitude.
The PSE 9,400 MW comparison from §3.4 lands here as the operational ceiling: even matching a single 1,000 MW gas plant on capacity would require batteries equal to today’s entire U.S. installed fleet, and those batteries would still need to be charged during multi-day Dunkelflaute events. That requires either firm generation or a renewable overbuild the region has not yet committed to.
GridLab’s review adds a nuance worth noting. Battery ELCCs depend on how the hydro system is operated and modeled. If hydro dispatch is co-optimized with battery storage, the capacity contribution improves. But that co-optimization requires the kind of coordinated regional dispatch that the fragmented market structure described in Section 3 makes difficult to achieve. The fix for batteries’ limitations loops back into the market problem.
6.3 “Just Build Gas Plants”
Gas plants score highest on the metric utilities use to measure winter reliability, and that fact has become the central obstacle in every regional planning conversation about how to close the capacity gap without building generation the region has committed to retiring. E3’s resource adequacy analysis found that a natural gas plant with firm fuel supply carries an effective load carrying capability of 92 to 93 percent. While ELCCs are contested and changing based on technology improvements, improved dispatch strategies, and a host of other factors, no current resource has the same dispatchability characteristics for a winter peaking market.
The region’s clean energy laws exist because gas generation causes the harm those laws were designed to prevent. In Washington, Front and Centered documented what that harm looks like: communities of color face measurably higher exposure to fossil fuel air pollution, with a 34-point gap between white and Black residents on the state’s air pollution exposure index. Gas-fired power plants concentrate nitrogen oxides and particulate matter in the neighborhoods closest to them, and those neighborhoods are disproportionately low-income and nonwhite. The health consequences (premature death, cardiovascular hospitalizations, childhood asthma) are well established in the epidemiological literature and mapped at the census-tract level by Washington’s Environmental Health Disparities tool. CETA and Oregon’s HB 2021 were not enacted in a vacuum. They are the policy response to documented harm done to identifiable communities by the kind of generation that scores 92 percent on a reliability metric.
The question, then, is whether gas can close the upcoming capacity shortfalls despite the legal framework that constrains it, despite the physical vulnerabilities the January 2024 cold event exposed, and despite a procurement market that no longer favors utilities. On every count, the answer runs into walls.
Washington’s Clean Energy Transformation Act requires 100 percent clean electricity by 2045, with no alternative compliance mechanism for fossil generation. Oregon’s HB 2021 requires 100 percent clean by 2040. A gas plant permitted today and operational by 2029 would have a useful economic life of 30 to 40 years but a legal operating window of 16 years in Washington or 11 in Oregon. Financing a generation asset against a two-decade stranded-asset timeline changes the economics in ways that show up on balance sheets long before the retirement date. Lenders price the risk. Ratepayers carry it. SnoPUD’s 2025 IRP states the compliance challenge directly: CCS natural gas plants carry compliance risk under CETA requirements and face permitting complications and geological sequestration challenges. The utility did not include natural gas as a viable long-term resource. It has no emitting resources in its portfolio and does not plan to add any. For a utility that gets 76 to 85 percent of its power from BPA, the calculus is straightforward: why take on a stranded asset when the Tier 2 alternative, however expensive, carries no compliance risk at all?
Then there is the physical problem, which the January 2024 cold event turned from a modeling assumption into a documented near-miss. On the afternoon of the coldest day in years, the Jackson Prairie Underground Natural Gas Storage Facility, the largest in the Pacific Northwest, suffered a complete outage. Failed redundant fiber-optic cables shut down operations at a facility that can meet up to 25 percent of the region’s peak heating demand. Williams Companies issued an emergency notice warning that gas volumes in the Northwest Pipeline were dropping at a rapid rate and demanded immediate action to reduce loads. The facility recovered to 50 to 70 percent capacity within hours and reached full capacity by evening, but only after PSE issued urgent conservation appeals to customers across western Washington. The gas system was stressed at the same time the electric system was stressed, because both respond to the same weather. A resource whose fuel supply fails under the conditions it is supposed to protect against does not deliver 93 percent ELCC in practice, whatever the modeling assumes. The Oregon Energy Strategy, published after the event, noted that natural gas supply, critical not only for home heating but also for gas-fired electricity generation, was restricted due to an issue at a key gas storage facility during the same period that electricity demand across the region exceeded historic records. The electric grid and the gas pipeline are not independent systems. They are coupled systems that fail together.
And the procurement landscape has shifted underneath any utility that might still want to build. The same dynamic that Section 3 documented for renewables, Amazon outbidding PSE for the Sunstone solar project, applies to gas. Technology companies seeking dispatchable generation on compressed timelines have inflated costs and absorbed contractor capacity across the entire generation market. Utilities are no longer the only buyers, and they are rarely the fastest. A gas plant that takes four years to permit, finance, and construct enters service in 2029 or 2030, at the peak of a regional capacity crunch where every resource is being competed for by entities with larger balance sheets and fewer regulatory constraints.
None of this means gas will play zero role in the region’s near-term reliability picture. Some plants will run. PSE is currently upgrading the Centralia Coal plant to natural gas, and is planning additional gas in the future. Grant County PUD recently proposed gas turbines to help serve data center demand. The constraints, though, make gas very difficult to deploy at the scale the capacity gap demands, on the timeline the gap demands, without creating ratepayer liabilities that persist for decades after the plants are forced to close. The 92 percent ELCC number is real. So are the legal deadlines, the pipeline vulnerabilities, the health costs borne by frontline communities, and the competitive market that has moved past the era when a utility could simply decide to build a gas plant and expect to get it done.
6.4 “Just Build More Transmission”
Of all the fixes examined in this section, transmission is the one that addresses all three crises simultaneously. More transmission enables access to geographically diverse renewable resources. It reduces the cost of market fragmentation by improving interregional transfer capability. It allows utilities to reach beyond their BPA allocation and procure capacity from distant generators. If the region could build transmission quickly, the energy trap would loosen.
The region cannot build transmission quickly. New greenfield lines take 10 to 15 years from planning to energization. BPA owns approximately 75 percent of the region’s high-voltage transmission network, and its system is largely subscribed. Long-term firm transmission rights have been secured by existing users, many for renewable energy delivery. SCL’s IRP advisory materials note that granting additional long-term firm point-to-point rights to deliver into the Seattle area will require transmission upgrades that may take years to complete. The system is full. Expanding it takes a decade.
Reconductoring offers a faster path. Emily Moore at Sightline Institute has documented that advanced composite core conductors can double capacity on existing rights-of-way in 18 to 36 months, using existing towers and existing environmental permits. Approximately 23,000 miles of Northwest transmission, roughly 40 percent of the regional grid, may be suitable for this treatment. It is the closest thing to a near-term solution the region has and we will return extensively to this in Section 7.
However, in the current solution set BPA is considering only older conductor technology (ACSS and ACSR varieties), not the advanced ACCC conductors that deliver the greatest capacity gains. Belgium has committed to reconductoring its entire high-voltage backbone by 2035. BPA has made no comparable commitment. And BPA’s $5 billion proposed transmission expansion, while substantial, addresses infrastructure maintenance and incremental improvement, not the transformative capacity increase the region needs.
The deeper barrier is institutional rather than technical. BPA’s transmission planning is not integrated with resource planning. Procurement decisions and transmission planning proceed in separate processes, on separate timelines, responding to separate stakeholder groups. The system can be described as a chicken-and-egg problem: a utility cannot secure transmission without a resource contract, because it cannot demonstrate need. A developer cannot secure a resource contract without firm transmission, because it cannot guarantee delivery. Neither can move first. The result is a system that requires coordinated action between parties whose processes are designed to operate independently.
6.5 “The Markets Will Sort It Out”
The region’s primary institutional response to the capacity crisis is a pair of new organized day-ahead markets and a resource adequacy compliance program. EDAM and Markets+ will optimize energy dispatch. The Western Resource Adequacy Program will ensure utilities demonstrate adequate capacity. Together, advocates argue, these mechanisms will enable efficient resource sharing across the West. Three structural limitations constrain what these mechanisms can deliver on the timeline the crisis demands.
WRAP is a compliance program, not a procurement mechanism. It requires participants to demonstrate they hold adequate capacity seven months before each season. If a utility is short, WRAP identifies the shortfall. It does not procure the missing capacity, fund new construction, or direct investment. Binding operations begin Winter 2027/2028 with 16 participants. The program’s voluntary architecture creates exit ramps: SnoPUD shifted its WRAP obligations to BPA by electing a Load Following product under the Provider of Choice contract, illustrating how an individual utility can avoid the program’s discipline while remaining technically compliant.
The market split reduces the benefits these platforms can deliver. FERC staff have warned that the EDAM/Markets+ seam will reduce trading efficiency. Grid Strategies found that market seams reduce benefits by approximately two-thirds.
Neither market includes a capacity mechanism. EDAM and Markets+ optimize energy dispatch on a day-ahead and real-time basis. They do not ensure that sufficient generation capacity exists years in advance to meet the region’s growing needs. The Western Interconnection explicitly rejected capacity markets. The PJM detour in Section 4 showed what happens even when a capacity market does exist: three consecutive record-breaking auction price caps, a 6,600 MW reliability shortfall, and a physical system that cannot respond to the price signals the market sends. The Pacific Northwest has chosen to go without that mechanism entirely. The markets will optimize what the region builds. However, it will not ensure the region builds enough resources to meet the coming capacity crunches.
6.6 “Renewables Will Fill the Gap”
Currently there are over 120 GW of renewables sitting in BPA’s interconnection queue. If even a fraction of that pipeline reached commercial operation, the region’s energy needs would be covered many times over. On paper, the queue looks like an abundance of resources just waiting to come online to provide the much needed capacity.
Execution turns abundance into scarcity. The execution barriers documented in §3.4 — single-digit national completion rates, average timelines beyond five years, BPA’s queue reformed but still backlogged — apply directly to the queue holding 120 GW of Pacific Northwest renewables. The sheer volume of resources needed across the entire Western Interconnection, not just in the Pacific Northwest, means intense competition for equipment, labor, and interconnection capacity.
Federal policy has shifted the economics underneath these projects. The One Big Beautiful Bill Act, signed in July 2025, imposed a July 4, 2026 safe harbor deadline for wind and solar projects to qualify for IRA tax credits. The five percent safe harbor method for establishing the beginning of construction has been eliminated. For a reader picking up this paper in spring 2026, that deadline is weeks away. Every wind and solar project that has not begun construction by July faces effective cost increases of $10 to $20 per megawatt-hour. Battery storage costs have risen 56 to 69 percent above 2023 projections, driven by tariffs. Solar panels face 26 to 49 percent tariffs on Southeast Asian imports. SnoPUD’s IRP assumption of 30 percent IRA tax credits may not hold for projects that miss the safe harbor window.
And during the winter events that define the region’s reliability challenge, renewable output is at its lowest. E3 found that wind provides only 10 to 24 percent ELCC and [solar provides 5 to 16 percent during critical winter periods][pc-e3-wind-elcc-10-24pct-winter]. Nameplate capacity is a measure of what a project can produce under ideal conditions. Dependable capacity during a January cold snap is something very different.
6.7 The Pattern
Every fix examined in this section runs into a wall built by one of the three crises. Batteries cannot solve multi-day winter reliability without coordinated hydro dispatch that market fragmentation prevents. Gas cannot be built at scale under laws that will strand the assets, and the fuel supply itself fails under the conditions that create peak demand. Transmission cannot move fast enough when the institution that controls 75 percent of it plans separately from the utilities that need it. Markets cannot procure capacity they are designed only to optimize. Renewables cannot fill the gap when most projects never clear the queue and federal policy has pulled the economic floor out from under the rest.
The region does not lack options. It lacks an institutional architecture capable of pursuing them in combination, at the speed the crisis demands. Section 7 asks what it would take to change that architecture.
Section 7: Paths Forward
7.1 The Coordination Problem, Not the Technology Problem
The Pacific Northwest has the technology it needs. Reconductoring can double transmission capacity in 18 to 36 months at half the cost of new lines. Iron-air batteries can provide 100-plus hours of storage at projected costs below $20/kWh. Demand response programs across the region remain largely undeployed. The interconnection queue holds roughly 2,300 GW of proposed generation nationally, 376 projects in BPA’s queue alone. The American grid runs at roughly 50 percent of its rated capacity on an average day, and the Pacific Northwest sits right in that range. The question the region faces is not what to build. It is how to coordinate what to build, how to use what it already has, and how to do both at the same time.
Every analysis examined in this paper points to the same structural failure: planning and budgeting happens at the individual utility level, but the crises operate at the regional level. The DOE’s PREPP study names this directly, and NWPCC’s regional planning process is hamstrung by this coordination challenge. BPA’s own economic analysis showed EDAM would deliver $69 to $221 million per year more than Markets+, yet BPA chose Markets+ because no governance structure existed to address its legitimate concerns about CAISO independence. As actors often optimize for their own constraints and concerns, the regional outcomes are worse for everyone, and will continue to worsen.
A Western RTO would solve much of this in theory. Three decades of failed efforts show it is not coming on the timeline the capacity crisis demands. What the region needs instead are bounded coordination mechanisms that work at the seams where the crises intersect, while respecting the institutional autonomy that communities and organizations across Washington have fought to maintain.
The instinct in energy planning is to sequence: build the big infrastructure first, then layer distributed resources on top. The Pacific Northwest cannot afford that ordering. A region that focuses exclusively on utility-scale buildout is at the mercy of interconnection queues where most projects never clear, PPA costs that have overrun IRP assumptions by 15 to 35 percent, and permitting timelines measured in decades. A region that focuses exclusively on distributed resources cannot close a multi-day winter reliability gap that demands firm capacity and interregional transfer capability. The utility-scale-only path drives costs higher because constrained supply pipelines inflate prices when every utility chases the same scarce resources simultaneously. The distributed-only path drives costs higher because deployment at the volume needed to substitute for bulk system capacity loses the economies of scale that make centralized infrastructure cost-effective.
The region needs both, built at the same time, because each reduces the cost and risk of the other. Distributed resources shrink the total centralized capacity the region must procure, easing pressure on congested interconnection queues and an overheated PPA market. Centralized infrastructure, transmission and long-duration storage in particular, provides the backbone that makes distributed resources viable during the extended winter events that define the region’s reliability risk. The sections that follow are organized around balancing these intervention points, first with what the bulk system needs (7.2), then with what the distributed layer needs (7.3), and finally how the two come together into a system that operates differently from what the region runs today (7.4).
7.2 Transmission: Building the System Washington Needs
On February 18, 2026, the Washington State Senate had SB 5466 queued for a final floor vote. The 39-page bill was designed to support transmission line buildout across the state, a priority for clean energy advocates who had worked on it for years. The votes for transmission hinged on simultaneously passing SB 5609, a separate bill protecting Native American cultural resources from construction damage. With 25 minutes before the 5 p.m. procedural deadline, Republican Floor Leader Shelly Short demanded SB 5466 be read aloud in full. Thirteen minutes into the reading, Lt. Gov. Denny Heck dropped the gavel. The transmission bill died. Senate Majority Leader Jamie Pedersen said the caucus had been wrestling with the cultural resources question “up until literally 4:35 that afternoon.” Transmission siting and tribal cultural resource protection were being negotiated against each other rather than integrated from the start.
Three weeks later, the legislature passed SB 6355. The replacement bill, sponsored by Sen. Victoria Hunt and eight co-sponsors, established the Washington Electric Transmission Authority as a public body within the Department of Commerce, empowered to plan, site, and finance transmission infrastructure across the state. It passed the Senate 30-19, cleared the House with bipartisan support (incorporating Republican amendments expanding Eastern Washington representation on the board), and was delivered to the Governor on March 13, the day after the session adjourned. Sightline Institute’s Emily Moore described the bill as enabling Washington to take a more active role in building infrastructure rather than depending entirely on BPA and individual utilities. The Clean Air Task Force noted the scale of the problem: since 2015, hundreds of generation projects have been waiting to connect to Washington’s grid, and only one has been approved.
SB 6355 separated the institutional question from the regulatory and permitting questions. It created the entity first and embedded tribal voice in its governance structure from the outset, with a mandatory board seat for a citizen of a federally recognized tribe and a standalone Tribal Clean Energy Partnership Work Group. This is closer to what CRITFC has recommended since 2003: build the institution with tribal participation baked into its design, rather than bolting on consultation requirements as an afterthought.
The new authority fills a gap this paper has identified throughout: no existing entity in Washington has the mandate to plan transmission across BPA, Seattle City Light, Puget Sound Energy, PacifiCorp, and the public utility districts simultaneously. BPA plans for its system. Each utility plans for its service territory. Nobody plans for the seams between them. The Washington Electric Transmission Authority (WETA) is designed to be that cross-boundary planning counterparty, with the ability to leverage state financing tools, pursue federal funding, and partner with experienced private transmission developers to build lines that no single utility would build on its own. Washington is not acting alone. The same week that SB 6355 cleared the legislature, California passed SB 254, establishing its own Transmission Infrastructure Accelerator to coordinate planning, facilitate public financing, and reduce project costs. Two of the largest Western states are now building state-level institutional capacity for transmission, independent of the federal government, at the moment when federal support is both most needed and least certain.
WETA is a beginning, not a solution. An executive director is not required until June 2027 and the first needs assessment is due in late 2026, but without staff or budget to conduct it, that timeline is aspirational. The 2026 WA legislative session operated under a $2.3 billion budget deficit, and the authority’s initial appropriation remains uncertain. Most importantly, the authority cannot override BPA’s federal transmission planning or mandate utility participation. It can coordinate, convene, finance, and partner. Whether that constellation of powers is sufficient to move projects at the pace the capacity shortfall demands remains an open question.
The regional data foundation for the authority’s work already exists. The Western Transmission Expansion Coalition (WestTEC), facilitated by the Western Power Pool, released its 10-Year Horizon Report in February 2026. An unprecedented partnership among utilities, tribal nations, state regulators, and environmental advocates, WestTEC identifies a portfolio of more than 12,600 miles of high-voltage transmission across the Western Interconnection. The total investment is $60 billion, with 9,400 miles of major planned projects already representing roughly $47 billion. About 20 percent of these planned projects are under or nearing construction, with the rest at varying stages of development. Reconductoring and rebuild projects represent approximately 10 percent of planned transmission in both line miles and costs. The portfolio would reduce power production costs by $500 million per year and add 10 gigawatts of interregional transfer capacity during times of need. WestTEC provides the actionable roadmap. The Washington Electric Transmission Authority is the institutional actor that can use it as a starting input for Washington-specific planning and investment, connecting regional analysis to state-level decisions about where to build, how to finance, and who to partner with.
While the long-term institutional work proceeds, utilities and advocates are already demonstrating what near-term deployment looks like. Reconductoring is the lever introduced in §3. The numbers from there — 23,000 miles potentially suitable, 40 percent of the regional grid, advanced composite core conductors doubling line capacity on existing rights-of-way — define the headroom. What §7.2 examines is whether BPA and state actors have committed to deploying it. The answer is “not yet”: BPA is considering only ACSS/ACSR, not the advanced ACCC conductors that deliver the greatest capacity gains. Belgium has committed to reconductoring its entire high-voltage backbone by 2035. BPA has made no comparable commitment.
Grid-enhancing technologies (GETs) offer additional capacity at a fraction of new-build costs. Puget Sound Energy launched a landmark dynamic line rating project with Heimdall Power in October 2025, installing 75 sensor units across 100 miles of transmission in five western Washington counties, one of the largest Dynamic Line Rating (DLR) deployments in the United States. PSE will evaluate the system through summer 2026 and use the results to guide wider DLR implementation across its network. The region needs many more pilots of GETs, and they all need to move much faster. Dynamic line ratings, advanced power flow controllers, and topology optimization are among the most cost-effective capacity interventions available, and the Pacific Northwest has barely started deploying them.
FERC Order 1920, requiring 20-year regional transmission plans, provides the federal framework for exactly this kind of coordinated planning. But the order’s implementation depends on the kind of cross-boundary institutional capacity that Washington is now building. The new transmission authority gives the state a seat at the table for Order 1920 compliance, an entity that can translate federal planning requirements into state-level investment decisions. Oregon is pursuing its own state transmission entity in parallel, and Sightline has identified four concrete policy reforms that could accelerate Oregon’s transmission permitting. If both states stand up institutional actors in the next two years, the Pacific Northwest will have the planning infrastructure to match the scale of the problem. If only one does, or if both take too long to become operational, the capacity shortfall will continue to outrun the planning.
These parts create a larger integrated solution and are core to building a more reliable, cost-effective, and efficient grid. WestTEC provides the regional roadmap. The Washington Electric Transmission Authority provides the institutional actor. PSE’s DLR pilot demonstrates that near-term optimization works. Advanced conductors offer a decade of capacity gains using existing corridors. FERC Order 1920 provides the federal mandate. What remains is execution: staffing the authority, funding its work, building the political coalitions to sustain it across election cycles, and ensuring that the tribal partnership structures written into the legislation produce genuine collaboration rather than procedural compliance. The region has failed at execution before. Whether it succeeds this time depends on whether the same urgency that resurrected a dead bill in three weeks can be sustained over the years it takes to build transmission.
Transmission planning operates on timescales no capacity crisis can wait for. The other half of the system, the distribution edge and the demand side, operates on timescales measured in months and quarters, and it is where the largest underused asset in the regional grid is sitting right now.
7.3 Distributed Resources and Demand-Side Innovation
Washington ratepayers have watched their electricity bills climb roughly 25 percent over the past six years. During the same period, the cost of generating electricity has fallen, pushed down by cheap renewables. What has risen is everything between the power plant and the meter. Transmission lines. Substations. Transformers. Distribution feeders. The grid itself. And most of that grid sits unused most of the time.
The national average is roughly 50 percent. That is the share of its rated capacity the American grid uses on a typical day. It has been drifting down for decades, even as utility capital spending has climbed. The Pacific Northwest fits the pattern. Its hydroelectric system is sized for peak water years and peak load days. Its transmission network is sized for the rare January morning when a cold snap collides with a wind drought. On most days the grid is half-used, but everyone using electricity is still paying the full cost.
The Brattle Group put a price on that idleness in a March 2026 study called The Untapped Grid. A 10 percent improvement in system utilization, defined as total energy delivered relative to available capacity, would reduce retail rates by 3.4 percent. That figure compounds. Across the national grid over a decade, Brattle estimates ratepayer savings of $110 to $170 billion. The mechanism is pedestrian. An airline spreads the fixed cost of the aircraft across every ticket it sells, and selling more tickets lowers the per-seat cost. The grid works the same way, except ratepayers have already paid for the aircraft. Running more electrons across infrastructure whose carrying costs are already baked into every bill makes every bill smaller.
While a frequent interjection by industry interest groups is that data centers and other large loads can play a role in increasing usage flexibility, as we saw in our discussion of data center growth, distributed resources and demand-side programs remain the fastest deployable tools the region has to address the capacity gap. A demand response program can be designed, piloted, and scaled within a utility’s existing rate case cycle. Vehicle-to-grid installations, residential battery deployments, and smart thermostat programs can begin delivering capacity within months of launch. Where transmission and utility-scale generation operate on timelines measured in years and decades, distributed resources operate on timelines measured in months and quarters. That speed advantage is not a minor benefit. It is the difference between having resources available during the next winter stress event and having resources available during a winter stress event five to ten years from now.
But speed is only the first reason the region needs distributed resources built alongside, not after, the bulk system. The second reason is cost. Every megawatt of peak demand that distributed resources can shave is a megawatt that does not have to be procured through a congested interconnection queue, at PPA prices that have overrun IRP assumptions by 15 to 35 percent, in competition with technology companies whose capital budgets dwarf utility revenue. The more the region can reduce its total centralized procurement requirement, the less pressure it places on a supply pipeline that is already oversubscribed and overpriced. Distributed resources do not merely supplement bulk system buildout. They make bulk system buildout more affordable by reducing the total volume the region needs to procure through that constrained channel.
The third reason is resilience. The January 2024 cold event demonstrated that centralized systems fail in correlated ways: the same weather that spikes electric demand constrains gas supply, stalls wind generation, and blocks solar output simultaneously. A grid that depends entirely on centralized resources concentrates its risk. Distributed resources, spread across thousands of buildings and vehicles and batteries, do not eliminate that risk, but they diversify it. A community with distributed storage and demand flexibility has options during a grid emergency that a community wholly dependent on utility-delivered power does not.
None of this changes the physics of the 100-hour constraint. The region’s resource adequacy challenge centers on sustained energy shortfalls during multi-day cold snaps and low-water years, the kind of extended events that 4-hour batteries and daily peak-shaving programs cannot address on their own. Demand response and distributed storage are not substitutes for the generation and transmission buildout the region needs. They are the complement that makes that buildout achievable: reducing total procurement requirements, buying time while longer-lead resources come online, and building the institutional muscle and market infrastructure that will matter enormously as electrification drives more load to the distribution edge of the grid.
Most PNW utilities are far behind where they need to be on this side of the equation. Seattle City Light’s 2022 IRP mentions demand response as a future resource option without specifying programmatic commitments. Snohomish PUD’s 2025 IRP anticipates 56 MW of peak reduction from demand response by 2035, a modest number relative to the regional shortfall. PSE has gone furthest, including V2B, V2G, V2H, and V2X in its IRP planning framework and actively piloting programs. But even PSE’s efforts remain small relative to the scale of need. The region has not yet built the policy frameworks, utility program capacity, or market signals to deploy distributed resources at the scale required.
Building those capabilities requires both policy implementation and technical learning. The Washington UTC and state energy agencies need to study what works in cold-weather markets that have deployed distributed resources effectively. Rate design, procurement authority, and interconnection streamlining are policy prerequisites. Program design matters as much as program existence. A 2025 survey of Northeast utilities by the Northeast Energy Efficiency Partnerships found that nine of thirteen opt-in TOU rate programs had customer enrollment below one percent. Opt-out programs told a different story: Delmarva Power’s opt-out critical peak rebate reached 93 percent of eligible customers. The PNW utilities exploring demand response and TOU rates are overwhelmingly designing opt-in programs. If Northeast participation patterns hold, these efforts will remain marginal contributions to a capacity gap unless regulators and utilities shift toward opt-out defaults with consumer protections built in.
Understanding how aggregated DERs perform during Pacific Northwest winter peaks, what participation rates are achievable, and which aggregation models work within regulated utility territory represents technical learning that can only come from deployment experience and iteration. CETA and CCA compliance create leverage for this work: the equity-targeting requirements in CETA’s Clean Energy Implementation Plans can direct distributed energy benefits toward overburdened communities, building distributed capacity and advancing environmental justice simultaneously.
The ecosystem the region needs, one where site developers, installers, utilities, energy experts, and policymakers share working relationships and operational knowledge, does not exist at scale in the Pacific Northwest. Innovation in distributed energy is producing structural models worth studying. In Texas, Base Power has demonstrated a vertically integrated approach to distributed battery storage: the company manufactures, installs, owns, and operates residential batteries, deploying them as a utility-scale capacity resource while providing homeowners with affordable backup power. The Pacific Northwest will need different structural innovations fitted to its regulated utilities, public power systems, and specific grid conditions. But the underlying insight, that distributed storage can function as a grid resource rather than merely a consumer product, and that vertical integration can achieve costs competitive with centralized alternatives, is going to be central to the future of the energy system.
Near-term electrification is already creating grid-interactive assets. PSE has installed vehicle-to-grid charging systems at Olympia and Snoqualmie Valley school districts. Electric buses take children to school during the day; during peak hours, V2G chargers allow PSE to draw power back from idle buses to support the grid. The buses also serve as backup power sources during emergencies. This represents a $612,000 PSE investment, with matching support from the Washington Department of Commerce. It is early, experimental, and small-scale. But it demonstrates the trajectory: every electrified vehicle, appliance, and building becomes a potential grid asset. The question is whether the region develops the programs, rate structures, and market signals to activate these capabilities in parallel with the bulk system buildout described in 7.2, rather than waiting until the big infrastructure is in place and then discovering the distributed layer needed to start ten years earlier.
States like Illinois, facing capacity price spikes and recognizing that market signals alone were too slow, have empowered their utility commissions to directly procure clean energy through legislation like the Clean and Reliable Grid Affordability Act. The argument is not that Washington should copy Illinois, but that state-level procurement authority provides a tool for moving faster than utility-by-utility IRP processes when the timing demands it, and that authority can be directed at both centralized and distributed resources simultaneously.
The organizations working on DER and demand-side deployment should see their work reflected in this section as structurally necessary, not as a consolation prize while the bulk system catches up. At the same time, the organizations pushing utility-scale transmission and generation should recognize that every megawatt of distributed capacity deployed reduces the total centralized build they are trying to push through a system that Section 6 showed cannot move fast enough. The two camps need each other. The region’s cost trajectory depends on whether they figure that out.
7.4 Building the Energy System the Region Deserves
Everything described so far operates within a larger transformation that is already underway. Ember’s research on what it calls the “electrotech revolution” tracks a set of reinforcing technology curves that have consistently outrun expert forecasts. Solar photovoltaic costs have fallen 99.6 percent since 1980. Wind turbine costs have fallen 80 percent since 1984. Battery costs have fallen 99 percent since 1991. These are observed learning curves, roughly 20 percent cost reduction with every doubling of deployment, compounding across decades. Solar generation went from the smallest to the largest source of new installed capacity on Earth in fifteen years. Battery storage capacity is growing at 71 percent per year globally. Global investment in electrotechnology now exceeds fossil fuel investment by a factor of two
Ember frames this as three reinforcing shifts happening simultaneously: in supply (solar and wind replacing combustion), in connections (batteries, smart meters, high-voltage transmission linking variable generation to flexible demand), and in demand (electric vehicles, heat pumps, and industrial electrification replacing direct fossil consumption). Each shift accelerates the others. Cheaper batteries make variable renewables dispatchable. Dispatchable renewables make electrification economic. Electrified demand creates the load growth that justifies more renewable deployment. The result is a self-reinforcing cycle with a structural cost advantage over fossil fuels that widens with every doubling of scale, because, as Ember puts it, “technologies get cheaper with scale; commodities get more expensive the deeper you dig.”
The Pacific Northwest sits at the convergence of this global transformation with a set of regional advantages no other part of the country possesses: the continent’s largest hydroelectric base, which provides the flexible balancing resource that variable renewables need most; clean energy mandates already in statute and being implemented; a technology sector generating both the demand and the innovation capital; and deep networks of committed activists, partners, and policy makers. The question is if the region builds the institutional infrastructure to harness it on its own terms, or whether the transformation happens to it in fragments, captured by whoever moves fastest rather than governed by the values the region claims to hold.
That institutional infrastructure is the subject of this section. The technology curves Ember documents are the tailwind. What the Pacific Northwest needs is not a plan for which technologies to deploy (the market is resolving that question with remarkable speed) but a systems architecture that allows utility-scale projects and bottom-up decentralized networks to reinforce each other rather than compete. The both-and framework from Section 7.1 described why the region needs centralized and distributed resources built simultaneously. Here, the argument goes further: the real opportunity is not parallel deployment of two separate tracks, but the emergence of a different kind of energy system, one where the bulk grid and the distribution edge operate as a single adaptive network.
Long-duration storage is the technology that makes this convergence tangible. When 100-hour iron-air batteries reach commercial deployment at Form Energy’s target of $20/kWh, or when competing pathways (compressed air, thermal storage, advanced flow batteries) reach similar economics, the same technology serves both scales. At utility scale, long-duration storage paired with reconducted transmission breaks the multi-day winter constraint that Section 6 identified as the region’s defining reliability vulnerability. At community scale, the same storage technology transforms a microgrid from a fair-weather resource into a genuine resilience asset, capable of sustaining essential services through the extended grid disruptions that a warming climate will deliver more frequently. The technology does not care whether it sits behind a substation or behind a community center. The institutional question is whether the region deploys it at both scales simultaneously, capturing the cost advantages and resilience benefits of each.
Consider what the region looks like when it does. A school in Twisp, in the Methow Valley, serves as the community’s emergency hub during wildfire season. Long-duration battery storage, paired with rooftop solar and a microgrid controller, allows the building to island from the grid for days when smoke chokes transmission corridors and fire threatens the lines that connect the valley to the outside world. During normal operations, that same battery participates in a regional flexibility market, earning revenue for the school district by absorbing excess midday solar or discharging during winter evening peaks. The building is simultaneously a school, a shelter, a power plant, and a grid asset. Nothing about this requires technology that does not exist. It requires institutional arrangements that do not yet exist: the interconnection agreements, the market participation rules, the utility program structures that let a school building play all of those roles.
Widen the lens. A tribal community on the Yakama Reservation, whose energy infrastructure has been chronically underfunded by a system built to serve someone else’s priorities, operates a community-owned microgrid anchored by long-duration storage and local wind generation. The microgrid reduces the community’s dependence on transmission infrastructure it did not choose, cannot control, and has historically been the last to see repaired after storms. During normal conditions, the microgrid trades with the regional grid through aggregation platforms, generating revenue that funds community services. During emergencies, it islands and sustains essential loads for days. The community is not off-grid. It is on the grid on its own terms, a participant rather than a dependent. This is what CRITFC has been calling for since 2003: energy infrastructure that serves tribal communities as principals, not as afterthoughts in someone else’s planning process.
Now multiply that pattern across a metropolitan grid. Across the Puget Sound, tens of thousands of residential batteries, heat pump water heaters, and electric vehicle chargers are enrolled in utility flexibility programs. Not as pilot projects serving a few hundred enthusiastic early adopters, but as standard utility offerings with opt-out enrollment, the way Delmarva Power’s critical peak rebate reached 93 percent participation. During a January cold snap, these distributed assets collectively reduce regional peak demand by hundreds of megawatts through automated, compensated response. Homeowners see lower bills and backup power during outages. The grid sees a virtual power plant that ramps in minutes, reducing the need for continued gas build out. The utility sees reduced need to procure scarce and expensive centralized generation through a congested interconnection queue.
Every electrified home and micro-grid is both consumer and contributor, and the market infrastructure to coordinate that contribution runs on transparent pricing and standardized enrollment, not on few pilot program managers working with challenging constraints. What matters here is not any single installation but the network effect: each node added to the system makes the whole system more flexible, more resilient, and less dependent on the constrained centralized procurement pipeline that Section 6 showed cannot deliver fast enough on its own.
None of these pictures require breakthroughs. They require deployment of technology that exists or is reaching commercial scale, within institutional structures that the region has the authority to build but has not yet built. The school microgrid requires interconnection rules that accommodate bidirectional community assets. The tribal microgrid requires funding mechanisms and governance structures that center community ownership. The residential fleet requires opt-out program design and flexibility market platforms. The technology is rapidly reaching maturity, but needs systematic work to create policy and reform institutions to integrate these resources.
The Pacific Northwest has the opportunity to build an energy system where the grid is not a one-directional delivery mechanism from dam to meter, but a network that learns from every node. Where transmission lines equipped with sensors and advanced conductors respond to real-time conditions. Where the Columbia River’s seasonal flows are complemented by storage that operates across timescales from hours to weeks, deployed at every level from the bulk system to the neighborhood. Where the communities most exposed to grid fragility, rural communities facing wildfire risk, tribal nations protecting treaty resources, low-income households bearing disproportionate energy cost burdens, are the first to benefit from the new infrastructure, not the last. Where the relationship between the river and the grid shifts from extraction to integration, because the system no longer depends on squeezing every kilowatt-hour from the dams during emergencies or building new gas turbines that its own planning failures created.
Wildfire risk is already pushing some of this into existence out of necessity rather than vision. Grid-edge communities in fire-prone areas of Washington and Oregon need islanding capability regardless of what centralized planning processes produce. As transmission and distribution costs continue growing faster than inflation (a structural feature of the regulatory model, not a temporary condition), the economic case for distributed alternatives strengthens year over year. Customers will pursue these alternatives whether utilities invite them to or not.
The choice for the region is whether distributed energy develops in coordination with the grid, creating mutual benefit, or in opposition to it, accelerating the cost shifts that make everyone worse off. That choice is the both-and thesis at the household level: the homeowner who installs battery storage can be a grid asset or a grid defector. Which one depends on whether the utility has built programs, rate structures, and market signals that make participation worthwhile.
The economic opportunity embedded in this transition is substantial. The region that develops the tools for coordinating distributed energy at scale, for integrating long-duration storage with hydro flexibility across both bulk and distribution systems, for building community resilience that strengthens rather than fragments the grid, will have created models that every region in the world will eventually need. The Pacific Northwest has the technical foundation, the policy frameworks, and the human capital to be that region. The convergence of economic opportunity and environmental justice is where this paper’s argument ultimately lands.
The question is not whether the technology will arrive. It is whether the institutions, the coordination mechanisms, and the political will can develop fast enough to deploy it on terms that serve the region’s communities — and whether utilities build the programs, rate structures, and market signals that turn distributed energy into a grid asset rather than a grid exit ramp.
Section 8: The Distance Between Futures
Return to January 2032. Seattle has been below twenty degrees for five consecutive days. Arctic air spilling through the Fraser River valley has settled over the region, held in place by a ridge of high pressure that blocks the Pacific storms that would normally push it out. The same high pressure system that trapped the cold has flattened the pressure gradients that drive wind. Turbines across the Columbia Basin stand still. Low clouds hide what little winter sun reaches this latitude in January. Demand is spiking. Electricity generation is collapsing. Every utility in the region is reaching for the same market at the same time.
In one future, the grid breaks. It breaks because BPA allocations calculated in 2026 cannot stretch to cover loads that have already exceeded them. Because a fragmented market delivers the least when every utility needs it most. Because roughly 8,700 megawatts of capacity that no individual utility can close were never built, and the resources that were built provide 3 to 6 percent of their nameplate when it matters. Because the interconnection queue completed too few projects on timelines that outran the crisis. Because every utility planned alone, each assuming market access that evaporated the moment everyone reached for it simultaneously. The rolling blackouts begin on day three. BPA faces the choice it faced in 2001: the lights or the river. The salmon protections go out first.
In the other future, the grid holds. It holds because the region reconducted transmission corridors that doubled capacity in 18 months on existing rights-of-way. Because distributed resources and flexibility markets reduced peak demand through automated, compensated response, not emergency appeals. Because long-duration storage broke the 100-hour constraint that made multi-day winter events the system’s defining vulnerability and utilities have been prepared to bring in new technology to their systems. Because cross-market protocols enabled resource sharing across the EDAM/Markets+ seam instead of waiting for problems to occur. While rates will still increase, the investments the region makes will go into building a different grid for the region advancing both distributed and decentralized power while strengthening large connections and cost effective generation and storage.
In Section 1, those two futures were scenarios. Now elements of how to get to a more coordinated future can be mapped to documented mechanisms, quantified constraints, and institutional decisions made or deferred by identifiable actors. The distance between these two futures is whether the region can build institutions whose planning architecture matches and ability to intake new ideas, technology, and ways of interacting are aligned with what the a future grid needs to operate. The idea that the region must build a different system rather than optimize the broken status quo not new. It is two decades old, and the institution that named it most clearly has been making the case for this whole system re-thinking since 2003.
The Columbia River Inter-Tribal Fish Commission (CRITFC) published its first Energy Vision in 2003, in direct response to the crisis that dropped juvenile steelhead survival from 40 to 70 percent to roughly 6 percent. They updated it in 2013 and revised it comprehensively in 2022. Across four presidential administrations and two decades of shifting energy politics, CRITFC maintained the institutional capacity to produce 43 specific recommendations spanning energy efficiency, renewable siting, transmission, resource adequacy, and market design.
The conclusion of their 2022 Energy Vision states what this paper has taken seven sections to demonstrate:
“The Northwest is at a critical crossroads, facing challenges to the health of the planet and the future of salmon, other tribal foods and iconic fish and wildlife. These challenges are especially important to tribal resources that have sustained tribal people since time immemorial. One path leads to affordable, carbon-free energy that harmonizes with the ecosystem and helps restore salmon. This future would prioritize energy efficiency, renewable resources, new storage technologies, reductions in peak loads, and other strategies that are compatible with the needs of fish and wildlife.… The other path creates conflicts between renewable resources and tribal resources and results in higher costs for consumers. Choosing the first path will require the courage to act, common-ground solutions, and a commitment of resources to accomplish the hard work ahead. It will also require the humility to periodically evaluate and adjust course based on new information and understanding.”
What CRITFC is describing in those closing lines is not a technical program or a set of resource targets. It is an institutional stance: the willingness to commit to coordinated action while remaining honest about what you do not yet know, to pair the courage to act with the humility to adjust course as conditions change. That is the stance the energy trap demands, and CRITFC has been modeling it for twenty years while the rest of the region’s energy planning institutions have not yet built anything comparable.
What CRITFC understood in 2003, and what this paper’s analysis confirms at the scale of the entire regional grid, is that the answer was never to manage salmon better within the existing system, just as the answer now is not to optimize utility planning within the current institutional architecture. It was, and is, to build a system where the impossible choices never arise: between the lights and the river, between BPA dependence and unaffordable alternatives, between coordination the region needs and governance structures the region does not yet trust.
The BPA Provider of Choice contracts are signed and run through 2044. BPA’s Markets+ commitment is proceeding, with legal challenges from Seattle City Light and state amicus filings still pending, but planning cannot wait for litigation. The IRA safe harbor deadline is July 4, 2026; for a reader picking up this paper in spring 2026, that deadline is weeks away. WRAP binding operations begin Winter 2027/2028. The Washington Electric Transmission Authority exists in statute but has no staff, no budget, and no executive director required until June 2027. The Ninth Power Plan is in development and will not be completed for years. Every one of these timelines is shorter than the sixteen-year duration of the contracts the region just signed.
But within those same sixteen years, long-duration storage will reach commercial scale, breaking the 100-hour winter constraint. Grid-enhancing technologies will transform transmission from static infrastructure into responsive, sensor-driven systems. Distributed resources will turn thousands of buildings, vehicles, and batteries into grid assets, orchestrated through flexibility markets the region has barely begun to design. The system the region contracted for in December 2025 is not the system it will be operating by the time those contracts mature. The world those contracts were designed for is already dissolving. The question is whether the institutions dissolve with it or adapt ahead of it.
If you build integrated resource plans, the most consequential thing you can do in your next planning cycle is stress-test your market access assumptions against your neighbors’ plans. If every utility in the region is counting on the same market purchases during the same winter stress events, the collective plan describes power that does not exist. No institution currently performs this cross-IRP analysis. PNUCC states explicitly that its regional forecast is not a resource adequacy assessment. The NWPCC’s Ninth Power Plan will be the most sophisticated synthesis available, and it updates every five years. Someone needs to read across IRPs on the planning cycle’s own timeline. That is work this paper attempts. It is work that needs to continue and deepen, with better data, more utilities, and institutional support.
If you work in state energy policy, the leverage points are identifiable. Washington’s next legislative session can fund and staff the transmission authority that SB 6355 created. It can require reconductoring assessments before new greenfield transmission construction. It can study state-level procurement authority modeled on what Illinois built with the Clean and Reliable Grid Affordability Act, adapted for the Pacific Northwest’s public power landscape. Oregon’s 2025 Energy Strategy identified the same needs. Neither state has yet acted on the interlocking constraints this paper describes.
If you participate in BPA’s stakeholder processes, you can push for advanced composite core conductors in reconductoring programs rather than the older technology BPA has so far considered. You can advocate for transmission planning that is integrated with resource procurement rather than conducted in a separate silo on a separate timeline. You can press for CHWM flexibility mechanisms in future rate proceedings, even within the constraints of signed contracts.
If you work in distributed energy, demand response, or community resilience, you should see your work reflected in this paper’s analysis. You should also understand where it fits: distributed resources buy time, build resilience, and develop the institutional muscle the region will need as electrification accelerates. They are necessary. They are not sufficient for the 100-hour constraint that defines the region’s reliability risk. The organizations building the distributed layer and the organizations pushing bulk system coordination need each other. Neither succeeds alone.
The system the region inherited was designed around a single river. Power generated at dams, flowing in one direction, through a transmission network planned for that pattern. The system the region needs is structured differently: a network where transmission lines equipped with sensors and advanced conductors respond to real-time conditions, where every electrified building and vehicle is both load and resource, where long-duration storage breaks the dependence on seasonal river flows for multi-day reliability, and where the communities most exposed to grid fragility are the first to benefit from the new infrastructure, not the last. The Columbia remains the anchor. What changes is everything built around it.
The institutions to operate this grid do not yet exist. But the ecosystem from which they could emerge does. Tribal organizations have been modeling sustained, values-driven energy governance longer than anyone else in the region. Think tanks and research institutions are mapping the policy terrain. Clean energy advocates, environmental justice coalitions, and community organizations are building the constituency for change. Independent analysts and utility planners are documenting the contradictions this paper describes. What the region lacks is the connective tissue: the mechanisms that link these efforts across institutional boundaries, that translate analysis into coordinated action, and that sustain engagement across the full twenty-year horizon of the contracts the region just signed.
CRITFC built that connective tissue for the tribes’ energy and salmon concerns, maintaining analytical focus and political engagement through two decades of shifting politics because the stakes demanded it. The broader energy planning community needs to build something comparable, not to replicate CRITFC’s model but to match its commitment: institutions capable of holding the regional picture in view while individual utilities, agencies, and legislatures make the decisions that accumulate, year by year, into one future or the other.
The Pacific Northwest built one of the world’s great energy systems on one river’s power. The next system will be built on the same region’s wind, sun, storage, and the intelligence of a grid designed to learn from every node. The three crises documented in this paper are constraints. They are also, if the region musters the courage to act and the humility to adjust course, the forcing function for building something the region has never had: coordination that matches the scale of the problem, sustained across the life of the contracts that will govern its resolution.
This paper is an invitation. We want sharper analysis, harder questions, and disagreement that would change our minds. Write us at hello@ridgelinecollab.org.